

Question: Markov chain density 17. 19.) Choose the correct statement: a) We can use the (Standardized) Normal Probability Density Function to compute the cumulative normal probabilities
Markov chain density
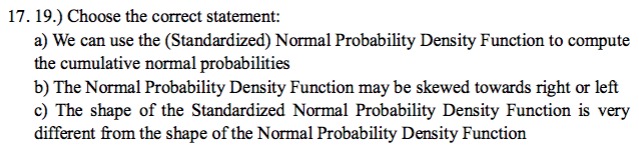
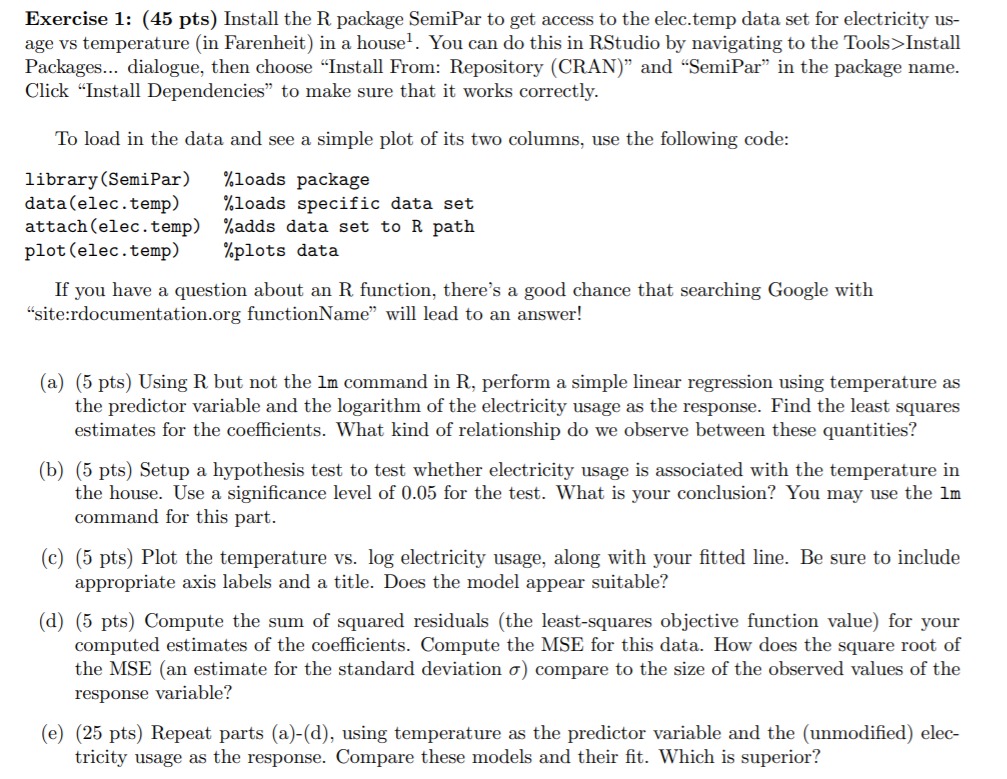
17. 19.) Choose the correct statement: a) We can use the (Standardized) Normal Probability Density Function to compute the cumulative normal probabilities b) The Normal Probability Density Function may be skewed towards right or left c) The shape of the Standardized Normal Probability Density Function is very different from the shape of the Normal Probability Density FunctionExercise 1: (45 pts) Install the R package SemiPar to get access to the elec.temp data set for electricity us- age vs temperature (in Farenheit) in a house . You can do this in RStudio by navigating to the Tools>Install Packages... dialogue, then choose "Install From: Repository (CRAN)" and "SemiPar" in the package name. Click "Install Dependencies" to make sure that it works correctly. To load in the data and see a simple plot of its two columns, use the following code: library (SemiPar) %loads package data (elec. temp) %loads specific data set attach (elec . temp) %adds data set to R path plot (elec. temp) %plots data If you have a question about an R function, there's a good chance that searching Google with "site:rdocumentation.org functionName" will lead to an answer! (a) (5 pts) Using R but not the Im command in R, perform a simple linear regression using temperature as the predictor variable and the logarithm of the electricity usage as the response. Find the least squares estimates for the coefficients. What kind of relationship do we observe between these quantities? (b) (5 pts) Setup a hypothesis test to test whether electricity usage is associated with the temperature in the house. Use a significance level of 0.05 for the test. What is your conclusion? You may use the Im command for this part. (c) (5 pts) Plot the temperature vs. log electricity usage, along with your fitted line. Be sure to include appropriate axis labels and a title. Does the model appear suitable? (d) (5 pts) Compute the sum of squared residuals (the least-squares objective function value) for your computed estimates of the coefficients. Compute the MSE for this data. How does the square root of the MSE (an estimate for the standard deviation o) compare to the size of the observed values of the response variable? (e) (25 pts) Repeat parts (a)-(d), using temperature as the predictor variable and the (unmodified) elec- tricity usage as the response. Compare these models and their fit. Which is superior?\f
Step by Step Solution
There are 3 Steps involved in it

Get step-by-step solutions from verified subject matter experts