Question: Marl Read the problem below and refer to the spreadsheet provided. The spreadsheet values highlighted in yellow can be manipulated in order to determine possible
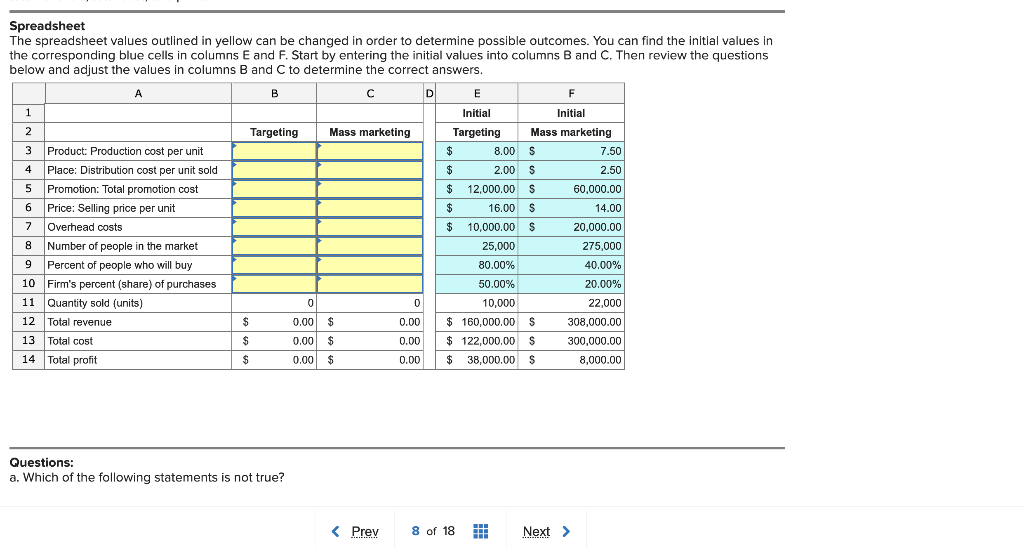
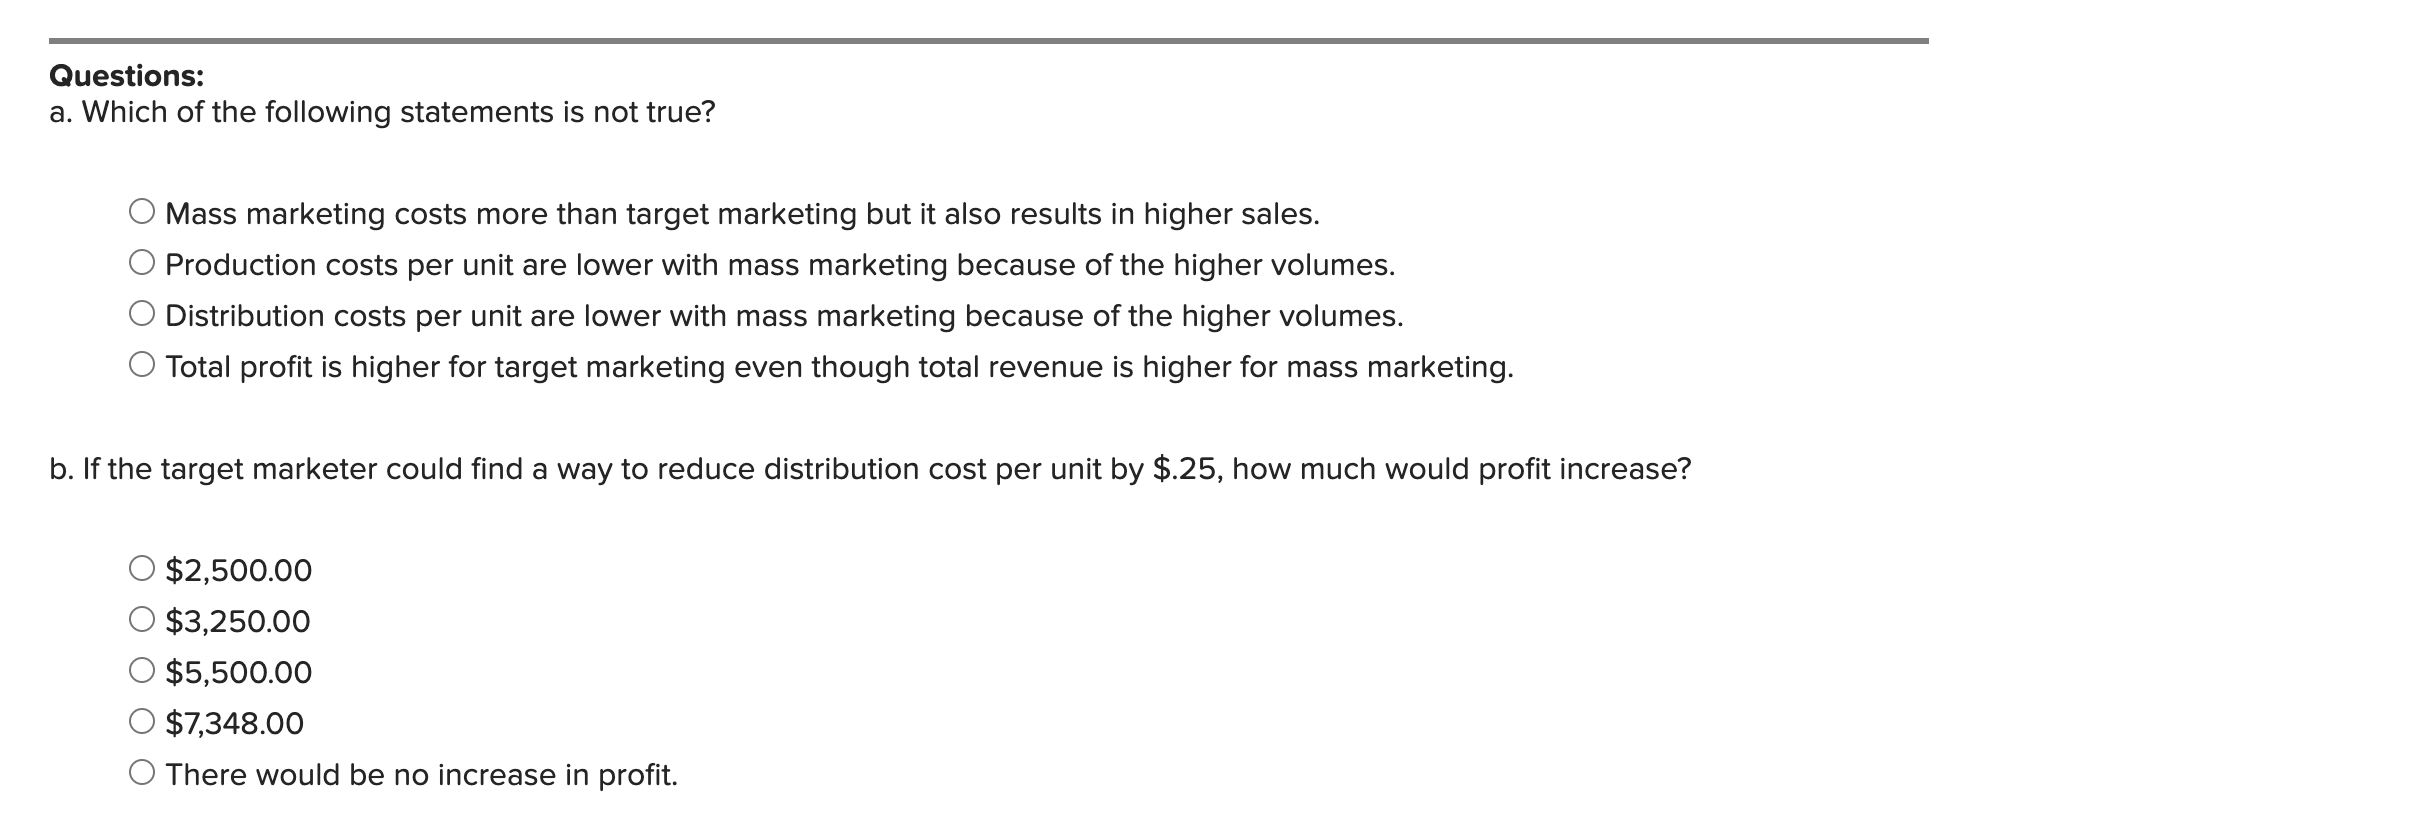
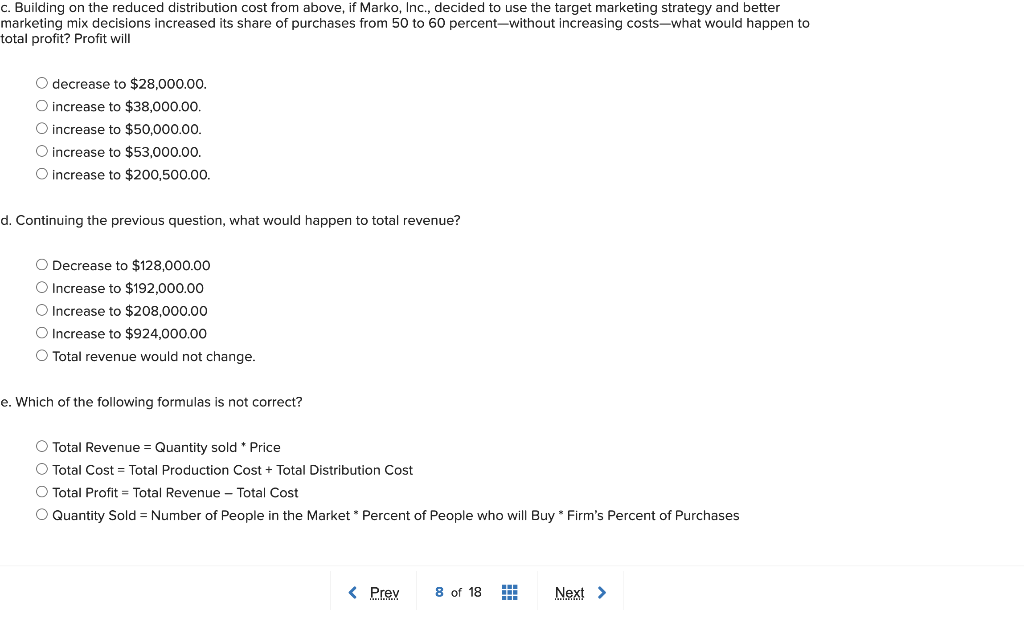
Marl Read the problem below and refer to the spreadsheet provided. The spreadsheet values highlighted in yellow can be manipulated in order to determine possible outcomes and answer the questions. You must answer the follow-up questions (a-e) correctly to receive full credit. Problem: Marko, Inc.'s managers are comparing the profitability of a target marketing strategy with a mass marketing "strategy." The spreadsheet gives information about both approaches. The mass marketing strategy is aiming at a much bigger market. But a smaller percent of the consumers in the market will actually buy this product-because not everyone needs or can afford it. Moreover, because this marketing mix is not tailored to specific needs, Marko will get a smaller share of the business from those who do buy than it would with a more targeted marketing mix. Just trying to reach the mass market will take more promotion and require more retail outlets in more locations-so promotion costs and distribution costs are higher than with the target marketing strategy. On the other hand, the cost of producing each unit is higher with the target marketing strategy-to build in a more satisfying set of features. But because the more targeted marketing mix is trying to satisfy the needs of a specific target market, those customers will be willing to pay a higher price. In the spreadsheet, "quantity sold" (by the firm) is equal to the number of people in the market who will actually buy one each of the product-multiplied by the share of those purchases won by the firm's marketing mix. Thus, a change in the size of the market, the percent of people who purchase, or the share captured by the firm will affect quantity sold. And a change in quantity sold will affect total revenue, total cost, and profit. Spreadsheet The spreadsheet values outlined in yellow can be changed in order to determine possible outcomes. You can find the initial values in the corresponding blue cells in columns E and F. Start by entering the initial values into columns B and C. Then review the questions below and adjust the values in columns B and C to determine the correct answers. Spreadsheet The spreadsheet values outlined in yellow can be changed in order to determine possible outcomes. You can find the inltlal values in the corresponding blue cells in columns E and F. Start by entering the initial values into columns B and C. Then review the questions below and adjust the values in columns B and C to determine the correct answers. Questions: a. Which of the following statements is not true? Questions: a. Which of the following statements is not true? Mass marketing costs more than target marketing but it also results in higher sales. Production costs per unit are lower with mass marketing because of the higher volumes. Distribution costs per unit are lower with mass marketing because of the higher volumes. Total profit is higher for target marketing even though total revenue is higher for mass marketing. b. If the target marketer could find a way to reduce distribution cost per unit by $.25, how much would profit increase? $2,500.00$3,250.00$5,500.00$7,348.00 There would be no increase in profit. c. Building on the reduced distribution cost from above, if Marko, Inc., decided to use the target marketing strategy and better marketing mix decisions increased its share of purchases from 50 to 60 percent-without increasing costs-what would happen to total profit? Profit will decrease to $28,000.00. increase to $38,000.00. increase to $50,000.00. increase to $53,000.00. increase to $200,500.00. d. Continuing the previous question, what would happen to total revenue? Decrease to $128,000.00 Increase to $192,000.00 Increase to $208,000.00 Increase to $924,000.00 Total revenue would not change. e. Which of the following formulas is not correct? Total Revenue = Quantity sold * Price Total Cost = Total Production Cost + Total Distribution Cost Total Profit = Total Revenue Total Cost Quantity Sold = Number of People in the Market * Percent of People who will Buy * Firm's Percent of Purchases Marl Read the problem below and refer to the spreadsheet provided. The spreadsheet values highlighted in yellow can be manipulated in order to determine possible outcomes and answer the questions. You must answer the follow-up questions (a-e) correctly to receive full credit. Problem: Marko, Inc.'s managers are comparing the profitability of a target marketing strategy with a mass marketing "strategy." The spreadsheet gives information about both approaches. The mass marketing strategy is aiming at a much bigger market. But a smaller percent of the consumers in the market will actually buy this product-because not everyone needs or can afford it. Moreover, because this marketing mix is not tailored to specific needs, Marko will get a smaller share of the business from those who do buy than it would with a more targeted marketing mix. Just trying to reach the mass market will take more promotion and require more retail outlets in more locations-so promotion costs and distribution costs are higher than with the target marketing strategy. On the other hand, the cost of producing each unit is higher with the target marketing strategy-to build in a more satisfying set of features. But because the more targeted marketing mix is trying to satisfy the needs of a specific target market, those customers will be willing to pay a higher price. In the spreadsheet, "quantity sold" (by the firm) is equal to the number of people in the market who will actually buy one each of the product-multiplied by the share of those purchases won by the firm's marketing mix. Thus, a change in the size of the market, the percent of people who purchase, or the share captured by the firm will affect quantity sold. And a change in quantity sold will affect total revenue, total cost, and profit. Spreadsheet The spreadsheet values outlined in yellow can be changed in order to determine possible outcomes. You can find the initial values in the corresponding blue cells in columns E and F. Start by entering the initial values into columns B and C. Then review the questions below and adjust the values in columns B and C to determine the correct answers. Spreadsheet The spreadsheet values outlined in yellow can be changed in order to determine possible outcomes. You can find the inltlal values in the corresponding blue cells in columns E and F. Start by entering the initial values into columns B and C. Then review the questions below and adjust the values in columns B and C to determine the correct answers. Questions: a. Which of the following statements is not true? Questions: a. Which of the following statements is not true? Mass marketing costs more than target marketing but it also results in higher sales. Production costs per unit are lower with mass marketing because of the higher volumes. Distribution costs per unit are lower with mass marketing because of the higher volumes. Total profit is higher for target marketing even though total revenue is higher for mass marketing. b. If the target marketer could find a way to reduce distribution cost per unit by $.25, how much would profit increase? $2,500.00$3,250.00$5,500.00$7,348.00 There would be no increase in profit. c. Building on the reduced distribution cost from above, if Marko, Inc., decided to use the target marketing strategy and better marketing mix decisions increased its share of purchases from 50 to 60 percent-without increasing costs-what would happen to total profit? Profit will decrease to $28,000.00. increase to $38,000.00. increase to $50,000.00. increase to $53,000.00. increase to $200,500.00. d. Continuing the previous question, what would happen to total revenue? Decrease to $128,000.00 Increase to $192,000.00 Increase to $208,000.00 Increase to $924,000.00 Total revenue would not change. e. Which of the following formulas is not correct? Total Revenue = Quantity sold * Price Total Cost = Total Production Cost + Total Distribution Cost Total Profit = Total Revenue Total Cost Quantity Sold = Number of People in the Market * Percent of People who will Buy * Firm's Percent of Purchases


