Question: MASTER TABLE: Activity Immediate Predecess Optimistic Pessimisti Varianc ES LS LF Slack Most Likely CP Var. Perform PERT/CPM analysis including the following steps: 1. Estimate
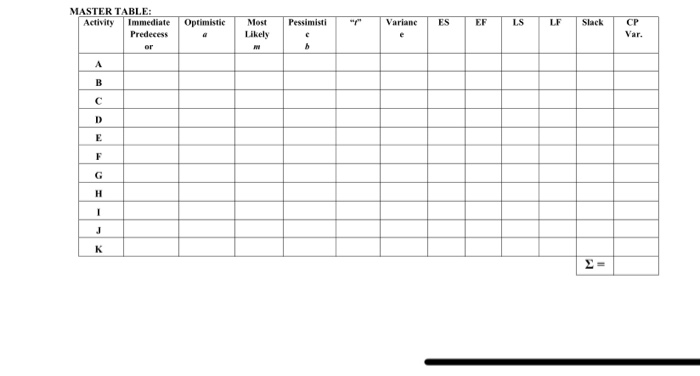
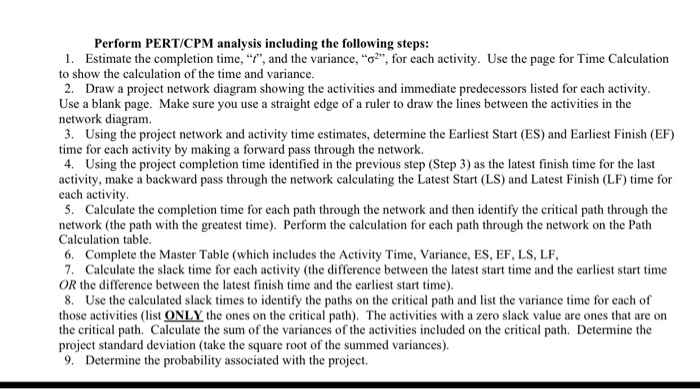
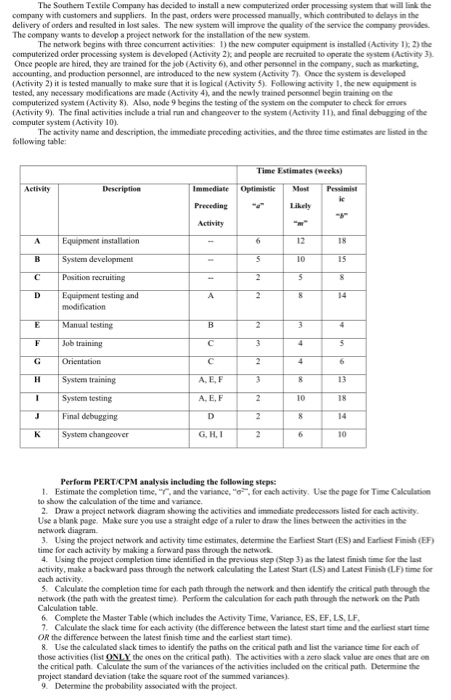
MASTER TABLE: Activity Immediate Predecess Optimistic Pessimisti Varianc ES LS LF Slack Most Likely CP Var. Perform PERT/CPM analysis including the following steps: 1. Estimate the completion time, "t", and the variance, "c2", for each activity. Use the page for Time Calculation to show the calculation of the time and variance. 2. Draw a project network diagram showing the activities and immediate predecessors listed for each activity. Use a blank page. Make sure you use a straight edge of a ruler to draw the lines between the activities in the network diagram. 3. Using the project network and activity time estimates, determine the Earliest Start (ES) and Earliest Finish (EF) time for each activity by making a forward pass through the network 4. Using the project completion time identified in the previous step (Step 3) as the latest finish time for the last backward pass through the network calculating the Latest Start (LS) and Latest Finish (LF) time for cach activity. 5. Calculate the completion time for each path through the network and then identify the critical path through the network (the path with the greatest time). Perform the calculation for each path through the network on the Path Calculation table. 6. Complete the Master Table (which includes the Activity Time, Variance, ES, EF, LS, LF, 7. Calculate the slack time for each activity (the difference between the latest start time and the earliest start time OR the difference between the latest finish time and the earliest start time) 8. Use the calculated slack times to identify the paths on the critical path and list the variance time for each of those activities (list ONLY the ones on the critical path). The activities with a zero slack value are ones that are on the critical path. Calculate the sum of the variances of the activities included on the critical path. Determine the project standard deviation (take the square root of the summed variances). 9. Determine the probability associated with the project. The Souther Textile Company has decided to install a new computerized onder processing system that will the company with customers and suppliers. In the past, orders were processed manually, which contributed to delays in the delivery of orders and resulted in lost sales. The new system will improve the quality of the service the y provides The company was to develop a project network for the installation of the new system The network begins with three concurrent activities: 1) the new computer equipment is installed Activity the computerized order processing system is developed (Activity and people are recruited to operate the stem Activity Once people are hired, they are trained for the job (Activity and other personnel in the company such as marketing accounting, and production personel are introduced to the new system (Activity . Once the system is developed (Activity 2it is tested many to make sure that it is logical Activity . Following activity 1. the w e nt is tested any ary medifications are made Activity and the newly and perceel begin the computer system (Activity Al d e begins the testing of the the computer to check for (Activity . The final activities include a trial run and changover to the system Activity and final of the computer system (Activity 10 The activity a n d description, the immediate preceding activities, and the three time estimates ested in the following tables Time Estimate ( s) Activity Description Immediate Optimista Most Preceding Activity Equipment installation System development Position recruiting Equipment testing and modification Manual testing Job training Orientation System training A, E, F System testing Final debugging System changeover GHI Perform PERT CPM analysis including the following steps 1. Estimate the completion time, and the variance for each activity. Use the page for Time Calculation to show the calculation of the time and variance 2 Draw a project work diagram showing the activities and immediate predecessor ed for each activity Use a blank page. Make sure you use a straight edge of a ruler to draw the lines between the activities in the network diagram 3. Using the project network and activity time estimates, determine the Earliest Start (ES) and Earliest Fish (EF) time for each activity by making a forward pass through the work 4. Using the project completion time identified in the previous step (Step 3) as the latest finish me for the last activity, make a backward pass through the network calculating the Latest Sort (LS) and Latest Finish L ine for Calculate the completion time for each path through the network and then identify the critical the network the path with the great time Perform the calculation for each path through the network the Calculation table 6 Complete the Master Table (which includes the Activity Time, Vrance, FS FFLS. LF 7. Calculate the deck time for each activity the difference between the latest start time the w est startime OR the difference between the latest finish time and the earliest start time) & Use the calculated stack times to identify the paths on the critical path and is the time for each of those activities (list ONLY the ones on the critical path). The activities with a redack value s the the critical path Calculate the sum of the variances of the activities included on the critical path Determine the project standard deviation take the square foot of the summed variances). 9. Determine the probability associated with the project