

Question: MAT 120 107 Test: Test 1 (Ch1 & Ch2) Question 9 of 20 This test: 100 point(s) possible This question: 8 point(s) possible Use a

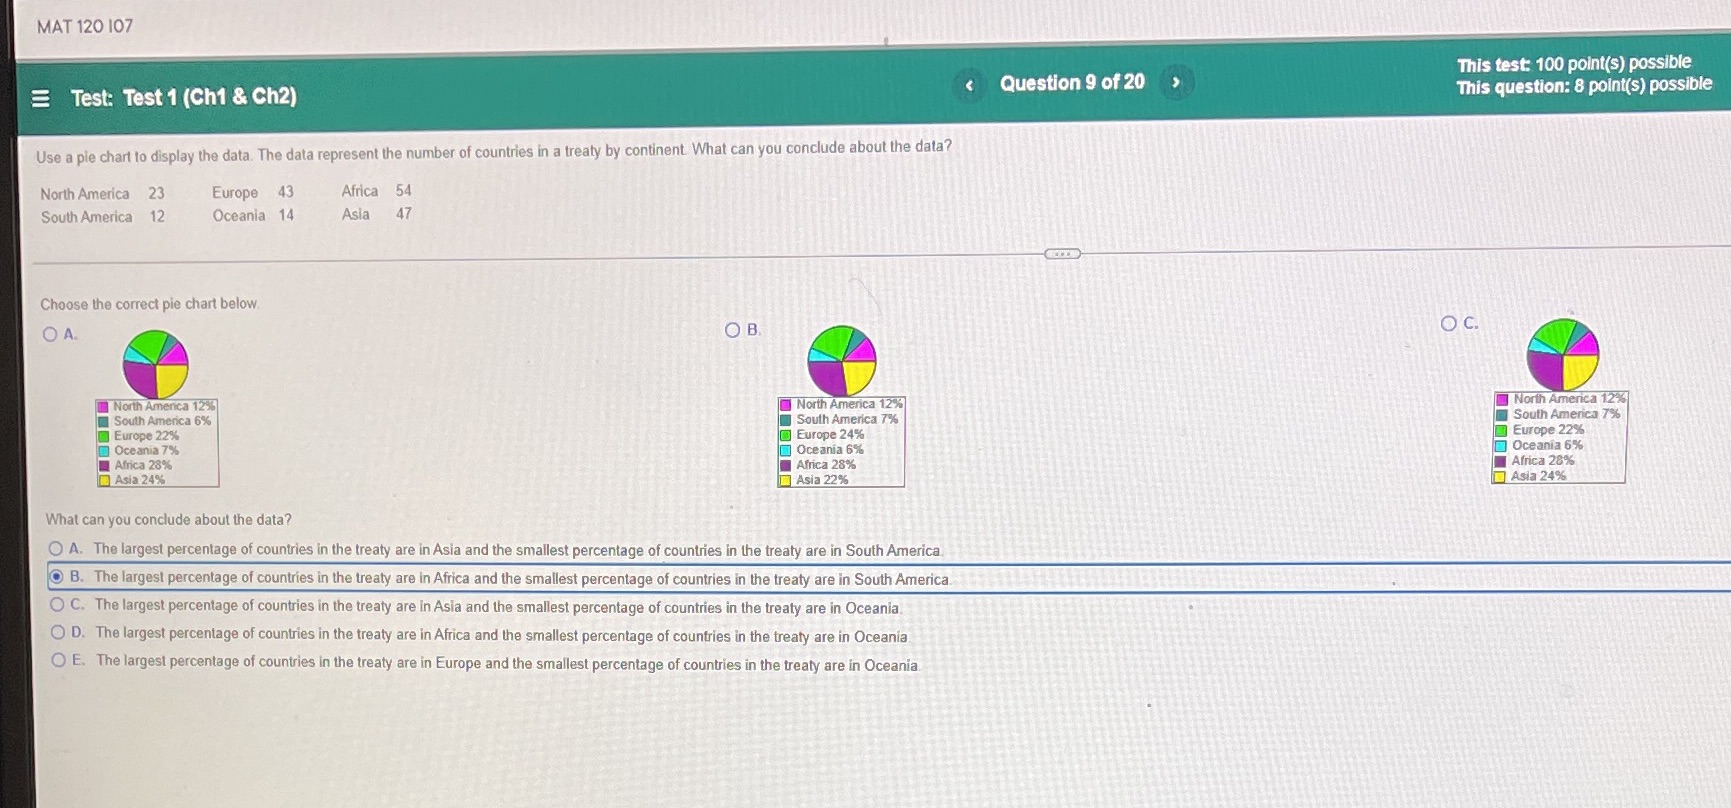
MAT 120 107 Test: Test 1 (Ch1 & Ch2) Question 9 of 20 This test: 100 point(s) possible This question: 8 point(s) possible Use a pie chart to display the data. The data represent the number of countries in a treaty by continent What can you conclude about the data? North America 23 Europe 43 Africa 54 South America 12 Oceania 14 Asia 47 Choose the correct pie chart below. O A. OB O C. North America 12%% North America 12 South America 6% North America 12% Europe 22% South America 7% South America 7% Europe 24% Oceania 7% Europe 22% Oceania 6% Africa 28% Oceania 6% Asia 24% Africa 28% Africa 28% Asia 225 Asia 24% What can you conclude about the data? O A. The largest percentage of countries in the treaty are in Asia and the smallest percentage of countries in the treaty are in South America B. The largest percentage of countries in the treaty are in Africa and the smallest percentage of countries in the treaty are in South America. O C. The largest percentage of countries in the treaty are in Asia and the smallest percentage of countries in the treaty are in Oceania O D. The largest percentage of countries in the treaty are in Africa and the smallest percentage of countries in the treaty are in Oceania O E. The largest percentage of countries in the treaty are in Europe and the smallest percentage of countries in the treaty are in Oceania
Step by Step Solution
There are 3 Steps involved in it

Get step-by-step solutions from verified subject matter experts