

Question: Mat 150 - Exam 5 a. Read chapter 2 - Calabar Culture and the Mathematical Implications, p. 26-32 on the Trans-Atlantic Slave Trade. b. During
Mat 150 - Exam 5
a. Read chapter 2 - Calabar Culture and the Mathematical Implications, p. 26-32 on the Trans-Atlantic Slave Trade.
b. During what period did the Trans-Atlantic Slave Trade thrive in West Africa?
c. Why is there a Slave Museum in Calabar?
d. What was the money used by the Efik people in Calabar to trade slaves?
e. State the set of known regions of West Africa that slaves were taken from.
f. State the total number of slaves reported to have been taken from each known region in West Africa.
g. State the overall total number of slaves reported to have been taken out of Africa
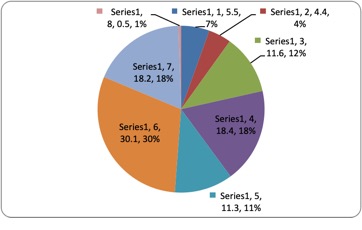
h. For the pie graph in Figure 2.8, identify which regions have which color
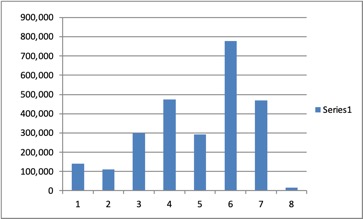
i. For the bar graph in Figure 2.10, identify which regions have which #
j. What is meant by raw data in statistics?
k. What is meant by primary data in statistics?
l. What is meant by secondary data in statistics?
m. Post your answers to b-l in the assignments folder created for this in the assignments section of blackboard.
Here is textbook- Chapter 2 - Calabar Culture and the Mathematical Implications on the transatlantic Slave Trade.
Slave Trade in Calabar
Calabar, the capital city of Cross River State is made up of the Efik tribe. It is one of the towns used to export human labour during the Trans-Atlantic Slave Trade. The Slave History Museum that documented the activities of slave trade is located at Marine Resort, Calabar. During this period in history, human labour (slaves) were shipped from Africa to the Americas and the Caribbeans in exchange for manufactured goods usually luxurious and consumable items from Europe. The popular saying that human beings are priceless has an exception in the case of slavery. The price of these slaves were calculated in iron and copper bars in Niger Delta, cowry shells in Yoruba land and manilas in Efik, Ibibio and Igbo lands. Slave trade though dehumanizing was one of the first forms of globalization as it encouraged the building of social and economic relationships between the various continents involved (Europe, America, Africa, etc). Slavery and slave trade thrived in West Africa from 1440 to 1833 (that is 15th to 18th centuries). During this period, about 22,000 slaves were sold annually from ports in Nigeria.
Below is the volume of English slave trade from Africa from 1690 to 1807:
141,300 Slaves was taken from Senegambia, 111,600 Slaves from Sierra Leon, 299,300 from Windward Coast, 473,800 from Gold Coast, 292,700 from Bight of Benin, 776,400 from Bight of Biafra, 468,300 from Angola and Mozambique and Others Unknown 16, 100.
Fraction
The teaching of fraction can be started by using the above story about slave trade, then the following:
The number of slaves taken from Senegambia (141,300) is part of the total number of English slave trade from Africa from 1690 to 1807 (2, 579, 500). This number 141, 300 is a fraction of the total number 2, 579, 500 and we can write 141, 300/2, 579, 500 to show that the number is part of the total. Fraction can therefore be defined as part of a whole. Fractions are normally written in their simplest reduced form. For instance, 141, 300/2, 579, 500 is better written as 1,413/25,795. This type of fraction is called proper fraction because the number on top called the numerator is smaller than the number below called the denominator.
Example: Find the fraction of slaves taken from each of the location given in the data.
Coastal Region Fraction of Slaves Reduced Form
Senegambia 141,300/2, 579, 500 1,413/25, 795
Sierra Leon 111,600/2, 579, 500 1,116/25, 795
Windward Coast 299,300/2, 579, 500 2,993/25, 795
Gold Coast 473,800/2, 579, 500 4,738/25, 795
Bight of Benin 292,700/2, 579, 500 2,927/25, 795
Bight of Biafra 776,400/2, 579, 500 7,764/25, 795
Angola and Mozambique 468,300/2, 579, 500 4,683/25, 795
Others Unknown 16,100/2, 579, 500 161/25, 795
The denominator of a fraction can be made to be 100 by multiplying the numerator by 100 and also the denominator by 100. When this is done, the resulting fraction is called percentage (per cent or 1/100). The fraction 1/100 is represented with special symbol %.
Example: Convert the above fractions to percentages.
Coastal Region Fraction Of Slaves Percentage Fractions
Senegambia 141,300/2, 579, 500 5.5/100 or 5.5%
Sierra Leon 111,600/2, 579, 500 4.4/100 or 4.4%
Windward Coast 299,300/2, 579, 500 11.6/100 or 11.6%
Gold Coast 473,800/2, 579, 500 18.4/100 or 18.4%
Bight of Benin 292,700/2, 579, 500 11.3/100 or 11.3%
Bight of Biafra 776,400/2, 579, 500 30.1/100 or 30.1%
Angola and Mozambique 468,300/2, 579, 500 18.2/100 or 18.2%
Others Unknown 16,100/2, 579, 500 0.5/100 or 0.5%
Other aspect of fraction can be introduced and taught.
Set
Teaching of set can be started by using the above slave story, then the following:
The Coastal regions where the slaves were taken can be put in a curly bracket (braces) and separated with a coma. The number of slaves taken from the coastal regions also can put in a bracket and separated with a coma as shown below.
Coastal Regions = {Senegambia, Sierra Leon, Windward Coast, Gold Coast, Bight of Benin, Bight of Biafra, Angola and Mozambique, Others Unknown}
Number of Slaves = {141300, 111600, 299300, 473800, 292700, 776400, 468300, 16100}
Each of the above is called a set. Coastal Regions is a set of regions where the slaves were taken from while Number of Slaves is a set of numbers representing the quantity of slaves taken from each region. Each region or number in the bracket is called an element or simply a member of the set.
Activity 2.1
What is a set?
A set is a well defined collection of elements enclosed in a curly bracket.
With the above, the teaching of other aspect of set can follow.
Assignment or Mapping
Consider the assignments done below
Coastal Regions Number of Slaves
Senegambia 141,300
Sierra Leon 111,600
Windward Coast 299,300
Gold Coast 473,800
Bight of Benin 292,700
Bight of Biafra 776,400
Angola and Mozambique 468,300
Others Unknown 16,100
To each coastal region, associate the number of slaves taken from there. Only one number of slaves is assigned to each coastal region. This type of assignment is called Mapping from a set of regions in the Coastal Regions (called the Domain of the mapping) to a set of Number of Slaves (called the Co-domain of the mapping). When the co-domain is a set of numbers as it is in this case, then the mapping is called a Function. Each number in the co-domain is called an image of the corresponding element in the domain. Every element in the domain must have an image for the mapping to be called a function. The set of images of all the elements in the domain is called the range of the mapping. The range is a subset of the co-domain.
No region/element in the Coastal Region is associated with more than one number of slaves. That is every region is assigned only one number. This type of mapping is called one-to-one or onto mapping
Activity 2.2
Give an example of (a) mapping that is unto (b) function
Statistics
Raw Data:The number of slaves taken from Senegambia during the Trans-Atlantic Trade is 141,300; 111,600 from Sierra Leon; 299,300 from Windward Coast; 473,800 from Gold Coast; 292,700 from Bight of Benin; 776,400 from Bight of Biafra; 468,300 from Angola and Mozambique and Others Unknown 16, 100.
The figures given above are known as data. Data is simply recorded observation. These can be processed to get information. This type of data is called secondary data because they are taken from records kept by another person. Data taken directly by those who witnessed the event is called primary data (That is first-hand information).
The above data can be put in a table so that at a glance one can get better picture and easily extract information from it.
COASTAL REGION NUMBER OF SLAVES
Senegambia 141,300
Sierra Leon 111,600
Windward Coast 299,300
Gold Coast 473,800
Bight of Benin 292,700
Bight of Biafra 776,400
Angola and Mozambique 468,300
Others Unknown 16,100
Total 2, 579, 500
The way the first data is presented is called Raw Data Presentation. The table above is one of the ways in which the data can be presented and it is called Tabular Presentation of Data.
If the number of slaves taken from each Coastal region is written as a fraction of the total taken from Africa and converted to percentage, we have
Coastal Region Number of Slaves Percentage
Senegambia 141,300 5.5
Sierra Leon 111,600 4.4
Windward Coast 299,300 11.6
Gold Coast 473,800 18.4
Bight of Benin 292,700 11.3
Bight of Biafra 776,400 30.1
Angola and Mozambique 468,300 18.2
Others Unknown 16,100 0.5
Total 2, 579, 500 100
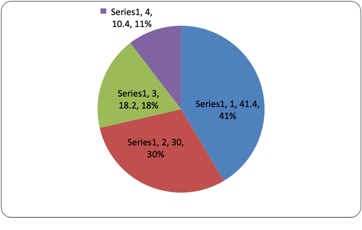
The above information can be presented in a circular chart called the pie -chart as given below
Step by Step Solution
There are 3 Steps involved in it

Get step-by-step solutions from verified subject matter experts