

Question: MAT 171 REGRESSION HOMEWORK Name _Brianne Ellenor FOR THIS ASSIGNMENT, YOU MAY CHOOSE FROM ALL TYPES OF REGRESSION THAT WE'VE STUDIED THIS SEMESTER. 1. Wine
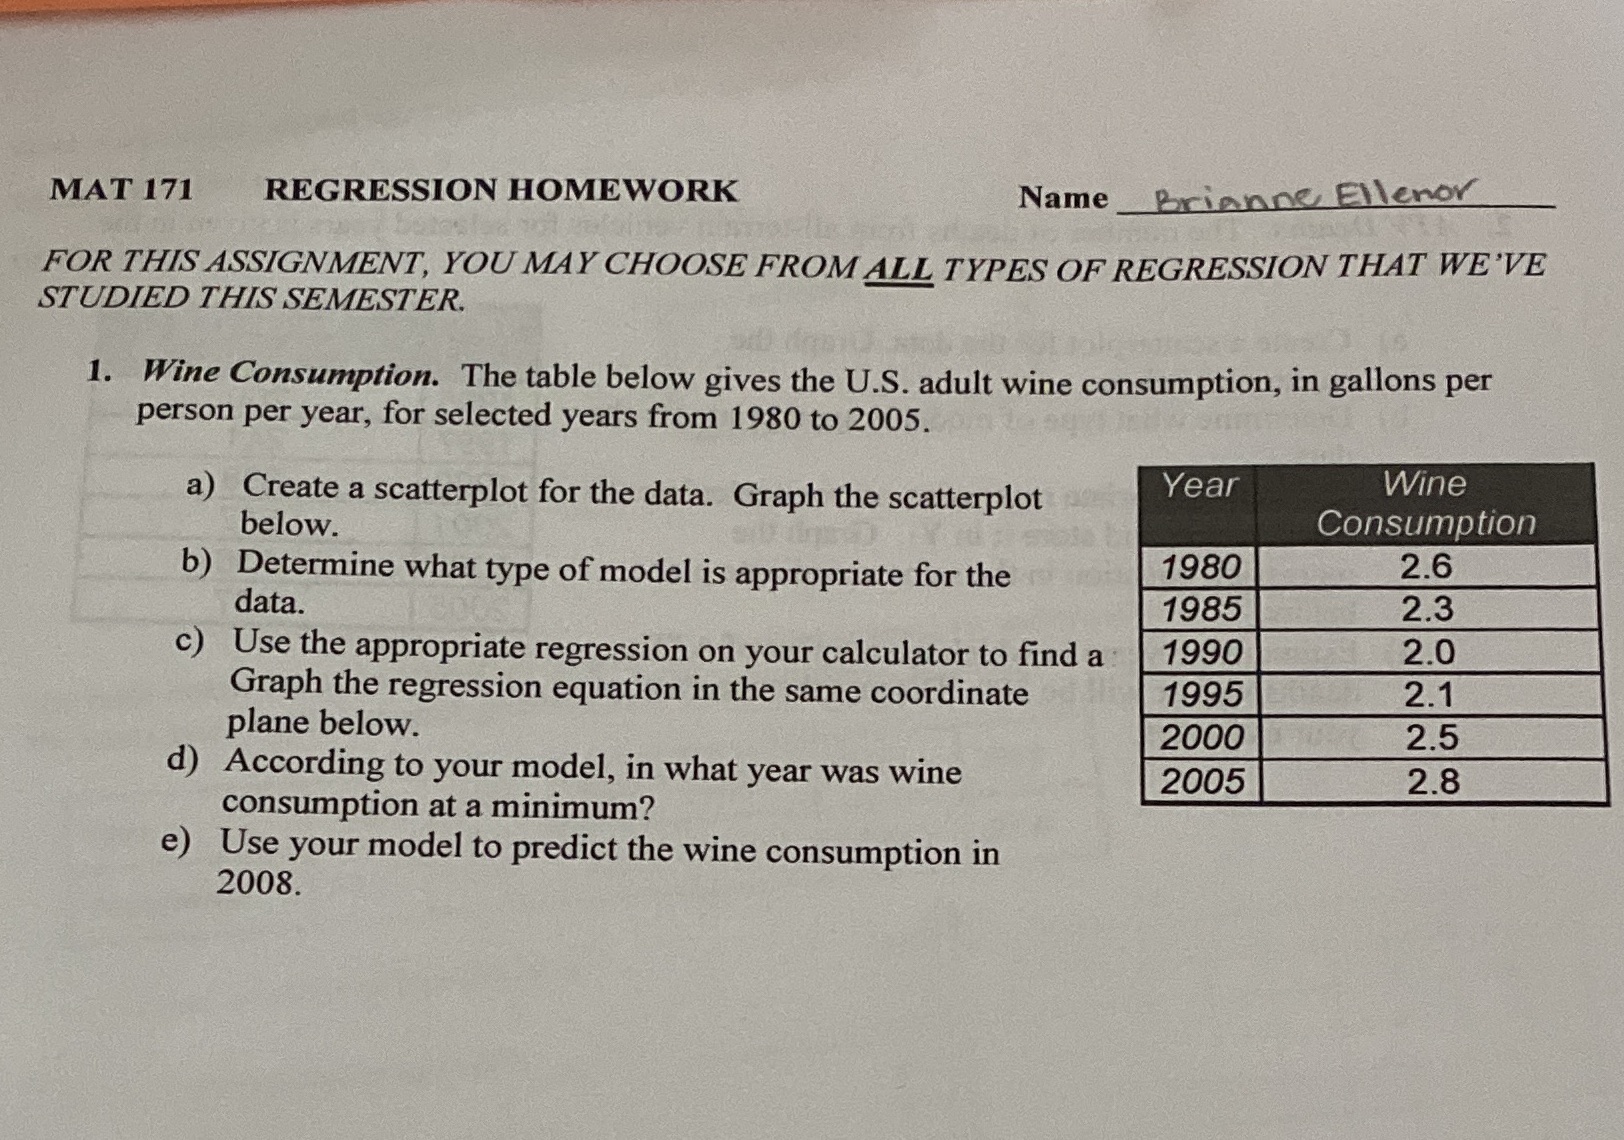
MAT 171 REGRESSION HOMEWORK Name _Brianne Ellenor FOR THIS ASSIGNMENT, YOU MAY CHOOSE FROM ALL TYPES OF REGRESSION THAT WE'VE STUDIED THIS SEMESTER. 1. Wine Consumption. The table below gives the U.S. adult wine consumption, in gallons per person per year, for selected years from 1980 to 2005. a) Create a scatterplot for the data. Graph the scatterplot Year Wine below. Consumption b) Determine what type of model is appropriate for the 1980 2.6 data. 1985 2.3 c) Use the appropriate regression on your calculator to find a 1990 2.0 Graph the regression equation in the same coordinate 1995 2.1 plane below. 2000 2.5 d) According to your model, in what year was wine 2005 2.8 consumption at a minimum? e) Use your model to predict the wine consumption in 2008
Step by Step Solution
There are 3 Steps involved in it

Get step-by-step solutions from verified subject matter experts