

Question: MAT1IMAB SPREADSHEET ASSIGNMENT 1 2022 1. Submit your solutions in the submission box on the MATIMAB LMS page. . You submissions must be a single
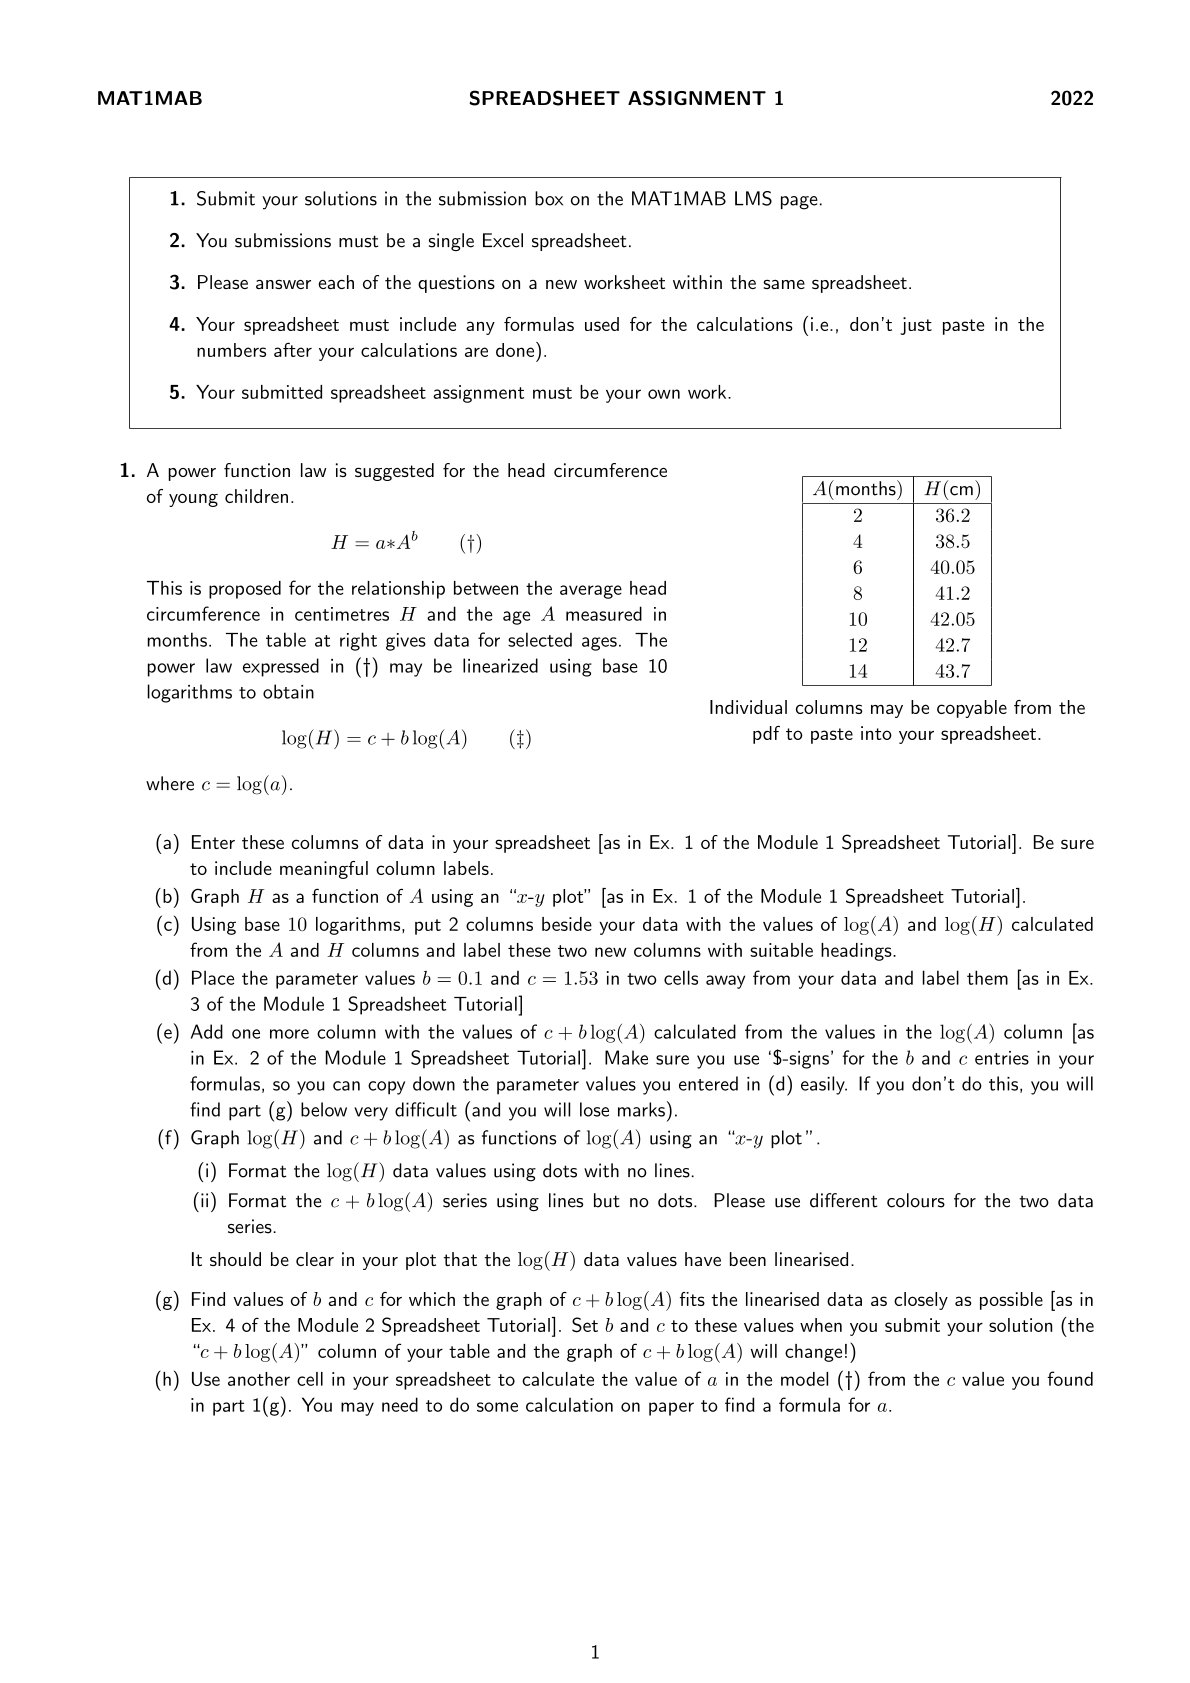
MAT1IMAB SPREADSHEET ASSIGNMENT 1 2022 1. Submit your solutions in the submission box on the MATIMAB LMS page. . You submissions must be a single Excel spreadsheet. . Please answer each of the questions on a new worksheet within the same spreadsheet. & W N Your spreadsheet must include any formulas used for the calculations (i.e., don't just paste in the numbers after your calculations are done). 5. Your submitted spreadsheet assignment must be your own work. 1. A power function law is suggested for the head circumference of young children. A(months) | H(cm) 2 36.2 H=axA" () 4 38.5 6 40.05 This is proposed for the relationship between the average head ] 11.2 circumference in centimetres H and the age A measured in 10 42.05 months. The table at right gives data for selected ages. The 12 49.7 power law expressed in (f) may be linearized using base 10 14 43.7 logarithms to obtain - Individual columns may be copyable from the log(H) = c+ blog(A) (1 pdf to paste into your spreadsheet. where = log(a). (a) Enter these columns of data in your spreadsheet [as in Ex. 1 of the Module 1 Spreadsheet Tutorial]. Be sure to include meaningful column labels. (b) Graph H as a function of A using an \"z-y plot\" [as in Ex. 1 of the Module 1 Spreadsheet Tutorial]. (c) Using base 10 logarithms, put 2 columns beside your data with the values of log(A) and log(H) calculated from the A and H columns and label these two new columns with suitable headings. (d) Place the parameter values b = 0.1 and = 1.53 in two cells away from your data and label them [as in Ex. 3 of the Module 1 Spreadsheet Tutorial] (e) Add one more column with the values of + blog(A) calculated from the values in the log(A) column [as in Ex. 2 of the Module 1 Spreadsheet Tutorial]. Make sure you use '$-signs' for the b and entries in your formulas, so you can copy down the parameter values you entered in (d) easily. If you don't do this, you will find part (g) below very difficult (and you will lose marks). (f) Graph log(H) and + blog(A) as functions of log(A) using an \"z-y plot\". (i) Format the log(H) data values using dots with no lines. (ii) Format the + blog(A) series using lines but no dots. Please use different colours for the two data series. It should be clear in your plot that the log(H) data values have been linearised. (g) Find values of b and for which the graph of + blog(A) fits the linearised data as closely as possible [as in Ex. 4 of the Module 2 Spreadsheet Tutorial]. Set b and to these values when you submit your solution (the \"c+ blog(A)\" column of your table and the graph of + blog(A) will change!) (h) Use another cell in your spreadsheet to calculate the value of a in the model () from the value you found in part 1(g). You may need to do some calculation on paper to find a formula for a. 2. Practice Class 3B introduced a difference equation model for retention in the bloodstream of a drug administered hourly. Assuming that three sevenths of the drug in the bloodstream is lost per hour through filtration by the liver, the model is AH.]_ = 11[_ % X AL +d, A.U =10 where A; is the amount (mg) in the bloodstream at hours and d is the hourly dosage (mg). It follows from the discussion in Practice Class 3B that this difference equation has closed form solution g(t) =1 xdx (1(%)t)' (a) Put the parameter d = 10 in a cell at the top of a new worksheet (and label it). (b) Tabulate values of from 0 to 24 in the first column (and include a column label). (c) Calculate the values of A; from = 0 to { = 24 by iteration [as in Ex. 1 of the Module 2 Spreadsheet Tutorial] in the next column and include a column label. Make sure you use '$-signs' for the d entry in your formulas, so you can copy down the parameter value you entered in (a) easily. If you don't do this, you will find part (f) below very difficult (and you will lose marks). (d) Use the method of Exercise 2 of the Spreadsheet Tutorial to calculate the values of A; from = 0 to t = 24 using the closed form solution g(t) in the next column. Label this column \"(7/3)d(1-(4/7) "t)". Again, make sure you use '$-signs' when copying down your formulas. (e) Create an x-y scatter plot of the two solution columns; use the Scatter with Smooth Lines and Markers option. Don't forget that the values in the first column will serve as your x-values in this case. Since the two graphs should agree exactly, you should only see one of them. (f) Use trial and error to adjust the dosage parameter d so that the long term drug level in the bloodstream approaches 140mg. Leave d set to this value when you submit your solution. 3. In this exercise, we will use iteration [as in Ex. 3 of the Module 2 Spreadsheet Tutorial] to calculate solutions for the SIR epidemic model Sii1 =S bS; Iy, Sy = 125,992 I =1 + bSil; kI, Iy =8 R+1 ;Ri"f"klrl, R()f' and explore the effect of changing the parameters and initial values. Here t is measured in days. (a) Put the parameters b = 0.000011 and k = 0.75 at the top of a new worksheet and label them. (b) Tabulate values of from 0 to 90 in the first column and include a column label. (c) Use the method of Exercise 3 of the module 2 Spreadsheet Tutorial to calculate the values of Sy, I; and R; from t = 0 to = 90 by iteration (and include column labels). As always, use '$-signs' for the parameter entries your formulas. It is easiest to drag down the formulas for all three columns at once. (d) Create a fourth column using appropriate cell formulas to calculate the total population Se+ I+ Ry at each time and label this column N. The values in this column should always be the same. If they are not, you have made a mistake and should check your work. (e) Create an @-y plot of the solution columns for S;, I; and R;. You should see an epidemic where the number of infectives peaks at 18 days. (f) In another cell in your table calculate the herd immunity for this model (and label it). (g) Use trial and error to adjust the recovery parameter k so that the herd immunity is as close to IN/4 as possible. Restrict your value of & to 4 decimal places. Leave k set to this value for your submission
Step by Step Solution
There are 3 Steps involved in it

Get step-by-step solutions from verified subject matter experts