

Question: Match each data analytics category with its corresponding business context by dragging each tile and placing it in the table below. Data Analytics Category Business
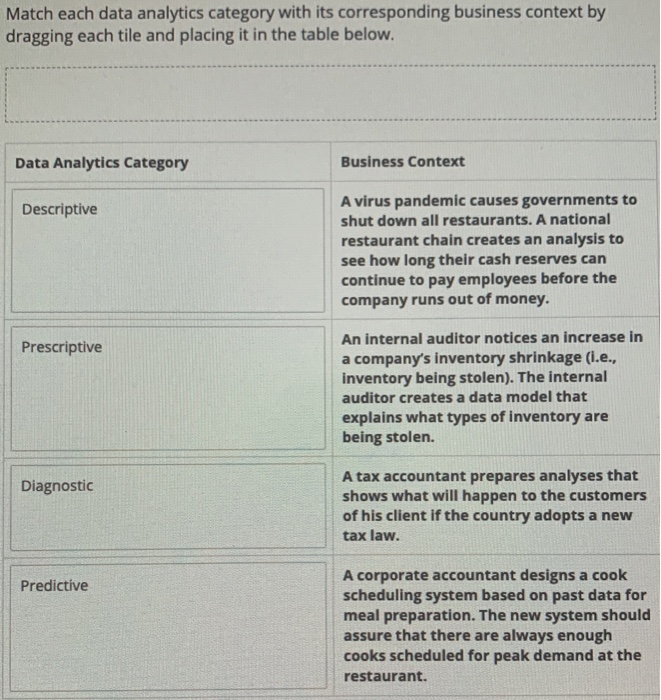
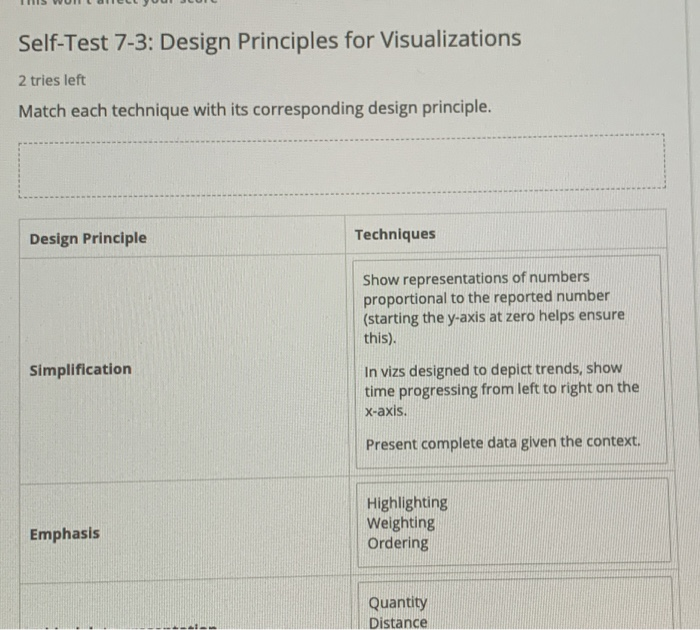
Match each data analytics category with its corresponding business context by dragging each tile and placing it in the table below. Data Analytics Category Business Context Descriptive A virus pandemic causes governments to shut down all restaurants. A national restaurant chain creates an analysis to see how long their cash reserves can continue to pay employees before the company runs out of money. Prescriptive An internal auditor notices an increase in a company's inventory shrinkage (i.e., inventory being stolen). The internal auditor creates a data model that explains what types of inventory are being stolen. Diagnostic A tax accountant prepares analyses that shows what will happen to the customers of his client if the country adopts a new tax law. Predictive A corporate accountant designs a cook scheduling system based on past data for meal preparation. The new system should assure that there are always enough cooks scheduled for peak demand at the restaurant. Self-Test 7-3: Design Principles for Visualizations 2 tries left Match each technique with its corresponding design principle. Design Principle Techniques Show representations of numbers proportional to the reported number (starting the y-axis at zero helps ensure this). Simplification In vizs designed to depict trends, show time progressing from left to right on the X-axis. Present complete data given the context. Highlighting Weighting Ordering Emphasis Quantity Distance Match each data analytics category with its corresponding business context by dragging each tile and placing it in the table below. Data Analytics Category Business Context Descriptive A virus pandemic causes governments to shut down all restaurants. A national restaurant chain creates an analysis to see how long their cash reserves can continue to pay employees before the company runs out of money. Prescriptive An internal auditor notices an increase in a company's inventory shrinkage (i.e., inventory being stolen). The internal auditor creates a data model that explains what types of inventory are being stolen. Diagnostic A tax accountant prepares analyses that shows what will happen to the customers of his client if the country adopts a new tax law. Predictive A corporate accountant designs a cook scheduling system based on past data for meal preparation. The new system should assure that there are always enough cooks scheduled for peak demand at the restaurant. Self-Test 7-3: Design Principles for Visualizations 2 tries left Match each technique with its corresponding design principle. Design Principle Techniques Show representations of numbers proportional to the reported number (starting the y-axis at zero helps ensure this). Simplification In vizs designed to depict trends, show time progressing from left to right on the X-axis. Present complete data given the context. Highlighting Weighting Ordering Emphasis Quantity Distance
Step by Step Solution
There are 3 Steps involved in it

Get step-by-step solutions from verified subject matter experts