

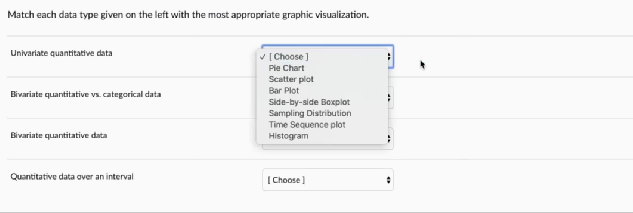
Question: Match each data type given on the left with the most appropriate graphic visualization. Univariate quantitative data [ Choose ] Pie Chart Scatter plot Divariate
![appropriate graphic visualization. Univariate quantitative data [ Choose ] Pie Chart Scatter](https://s3.amazonaws.com/si.experts.images/answers/2024/07/668301ca89c32_706668301ca68de4.jpg)
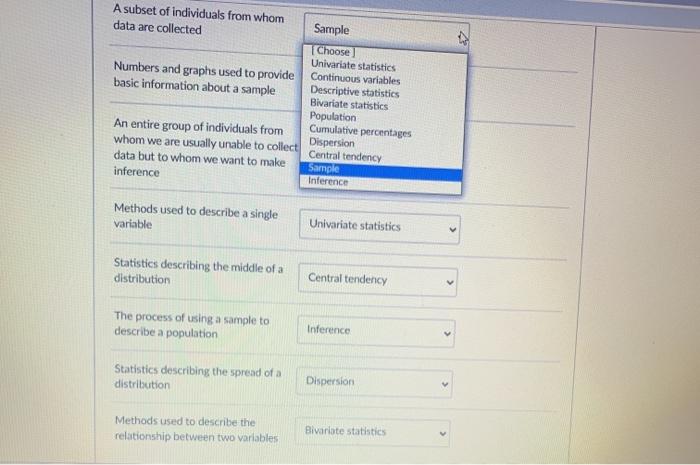

Match each data type given on the left with the most appropriate graphic visualization. Univariate quantitative data [ Choose ] Pie Chart Scatter plot Divariate quantitative vs. categorical data Bar Plot Side-by-aide Boxplot Sampling Distribution Time Sequence plot Divariate quantitative data Histogram Quantitative data over an interval I Choose ]minutes to complete this quiz. It is op Question 11 The chi-square is a C Bivariate hypothesis test Univariate hypothesis test CMultinomial hypothesis test C Binomial hypothesis test PreviousA subset of individuals from whom data are collected Sample [ Choose Univariate statistics Numbers and graphs used to provide Continuous variables basic information about a sample Descriptive statistics Bivariate statistics Population An entire group of individuals from Cumulative percentages whom we are usually unable to collect Dispersion Central tendency data but to whom we want to make Sample inference Inference Methods used to describe a single Univariate statistics variable Statistics describing the middle of a Central tendency distribution The process of using a sample to Inference describe a population Statistics describing the spread of a Dispersion distribution Methods used to describe the Bivarlate statistics relationship between two variables
Step by Step Solution
There are 3 Steps involved in it

Get step-by-step solutions from verified subject matter experts