

Question: % Parel (a) XXXX Quantity Quantity Panel (b) Question A decrease in the supply of Coke. A drop in average household income in the
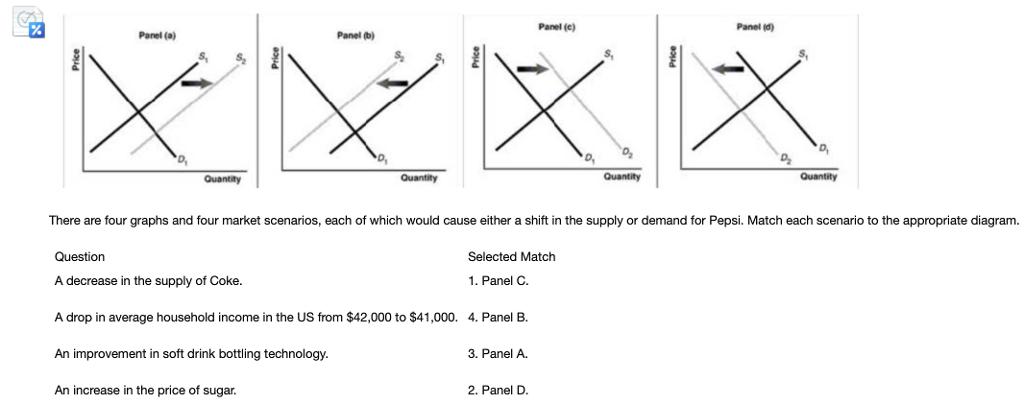
% Parel (a) XXXX Quantity Quantity Panel (b) Question A decrease in the supply of Coke. A drop in average household income in the US from $42,000 to $41,000. 4. Panel B. An improvement in soft drink bottling technology. An increase the price of sugar. Panel (c) 3. Panel A. 2. Panel D. Panel (d) Quantity There are four graphs and four market scenarios, each of which would cause either a shift in the supply or demand for Pepsi. Match each scenario to the appropriate diagram. Selected Match 1. Panel C. D Quantity
Step by Step Solution
3.38 Rating (164 Votes )
There are 3 Steps involved in it
a A decrease in the supply of sports drinks This can be interpreted as an increase in price of a sub... View full answer

Get step-by-step solutions from verified subject matter experts