

Question: Match each type of visualization with its corresponding purpose by dragging each tile and placing it in the table below. bar chart Scatterplot heatmap pie
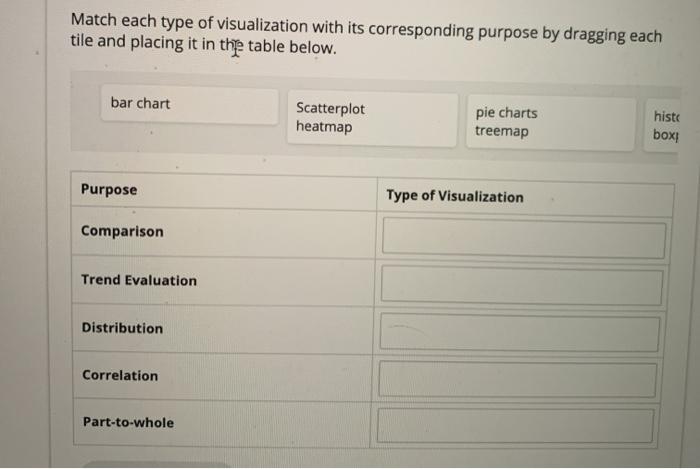

Match each type of visualization with its corresponding purpose by dragging each tile and placing it in the table below. bar chart Scatterplot heatmap pie charts treemap hist box Purpose Type of Visualization Comparison Trend Evaluation Distribution Correlation Part-to-whole histograms boxplots line chart area chart
Step by Step Solution
There are 3 Steps involved in it
1 Expert Approved Answer
Step: 1 Unlock

Question Has Been Solved by an Expert!
Get step-by-step solutions from verified subject matter experts
Step: 2 Unlock
Step: 3 Unlock