

Question: Match Match the best way to present data: Histogram (Bar Graph) Polygram (Line Graph) Pie Chart A college Dean wants to know the EXACT NUMBER
Match
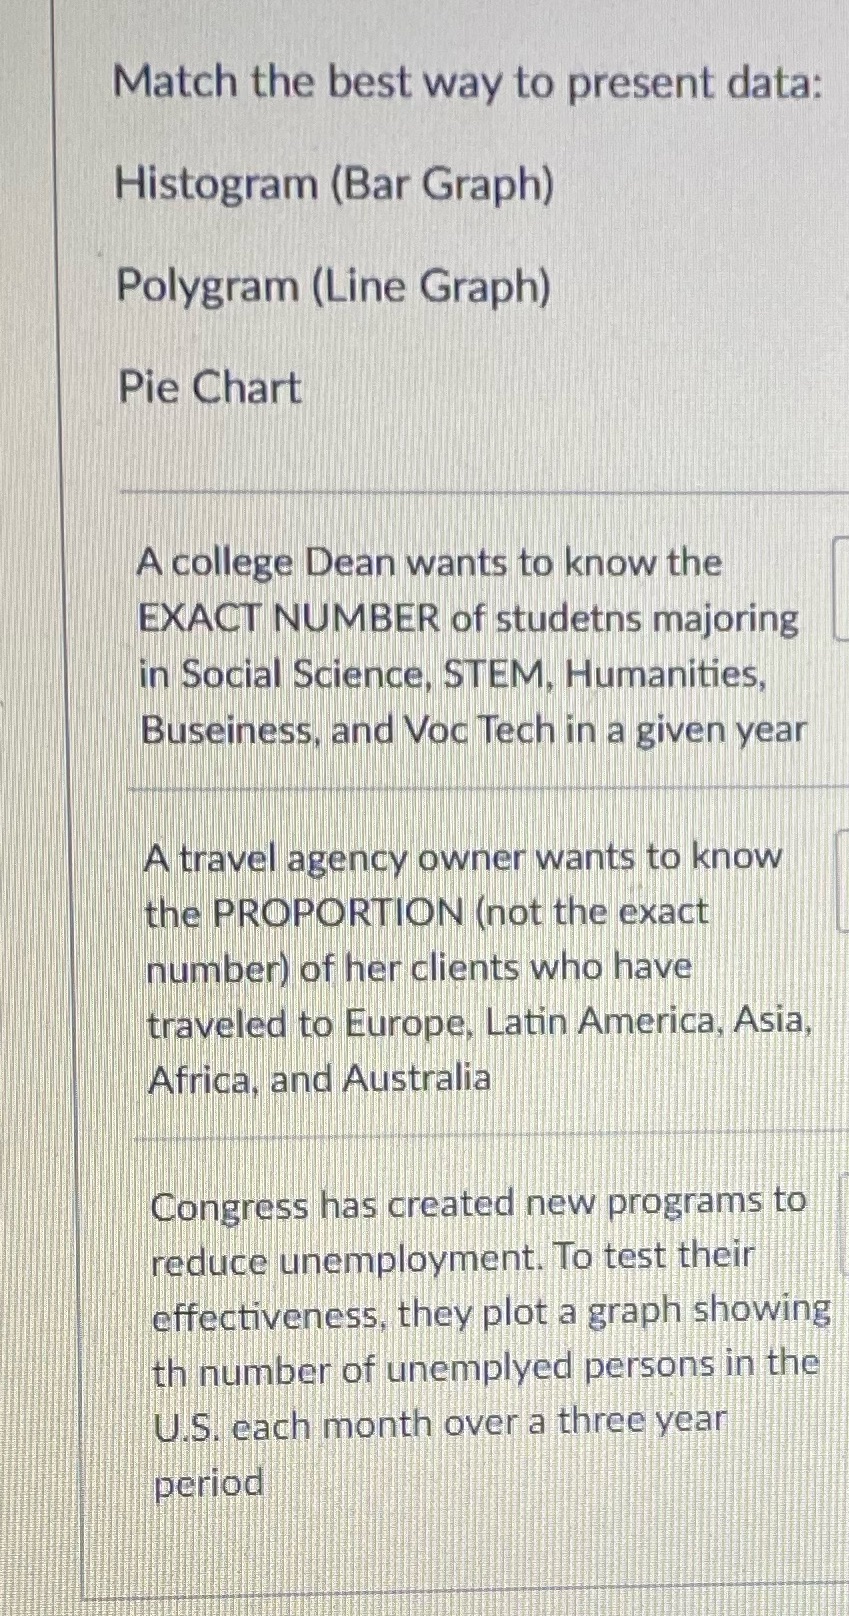
Match the best way to present data: Histogram (Bar Graph) Polygram (Line Graph) Pie Chart A college Dean wants to know the EXACT NUMBER of studetns majoring in Social Science, STEM, Humanities, Buseiness, and Voc Tech in a given year A travel agency owner wants to know the PROPORTION (not the exact number) of her clients who have traveled to Europe, Latin America, Asia, Africa, and Australia Congress has created new programs to reduce unemployment. To test their effectiveness, they plot a graph showing th number of unempled persons in the U.S. each month over a three year period
Step by Step Solution
There are 3 Steps involved in it
1 Expert Approved Answer
Step: 1 Unlock

Question Has Been Solved by an Expert!
Get step-by-step solutions from verified subject matter experts
Step: 2 Unlock
Step: 3 Unlock