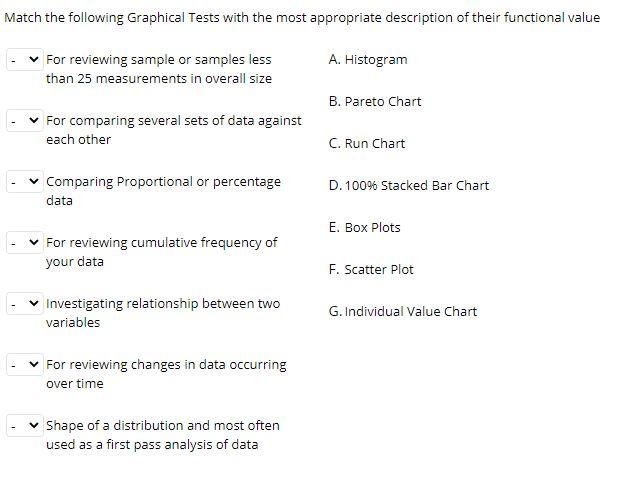
Question: Match the following Graphical Tests with the most appropriate description of their functional value A. Histogram For reviewing sample or samples less than 25 measurements

Match the following Graphical Tests with the most

Match the following Graphical Tests with the most appropriate description of their functional value A. Histogram For reviewing sample or samples less than 25 measurements in overall size B. Pareto Chart For comparing several sets of data against each other C. Run Chart Comparing Proportional or percentage data D. 100% Stacked Bar Chart E. Box Plots For reviewing cumulative frequency of your data F. Scatter Plot Investigating relationship between two variables G. Individual Value Chart For reviewing changes in data occurring over time Shape of a distribution and most often used as a first pass analysis of data

Step by Step Solution

There are 3 Steps involved in it

1 Expert Approved Answer
Step: 1 Unlock blur-text-image
Question Has Been Solved by an Expert!

Get step-by-step solutions from verified subject matter experts

Step: 2 Unlock
Step: 3 Unlock

Students Have Also Explored These Related General Management Questions!