

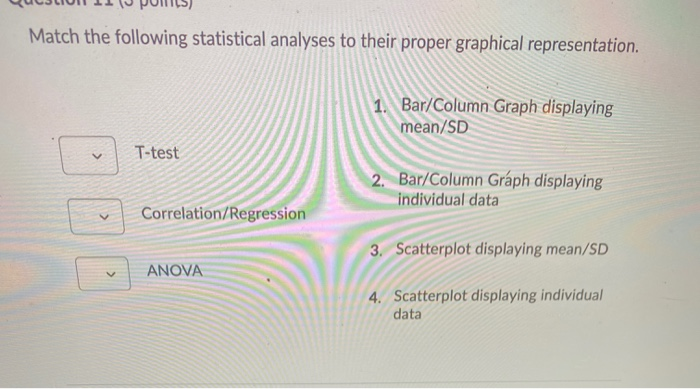
Question: Match the following statistical analyses to their proper graphical representation. 1. Bar/Column Graph displaying mean/SD T-test
Step by Step Solution
There are 3 Steps involved in it
1 Expert Approved Answer
Step: 1 Unlock

Question Has Been Solved by an Expert!
Get step-by-step solutions from verified subject matter experts
Step: 2 Unlock
Step: 3 Unlock