Question: Match the given below A. Graphical tool to display cause and effect relationship Quality Function Deployment (QFD) B. Ranking risks involved in a product or

Match the given below Match the given below A. Graphical tool to

A. Graphical tool to display cause and effect relationship Quality Function Deployment (QFD) B. Ranking risks involved in a product or process. Process flow chart C. How the features of a product generates satisfaction for customers D. A technique to maximize revenue by offering variable price SWOT analysis E. A technique to display how the activities relate to each other Failure Modes and Effect Analysis (FMEA) F. A technique to determine the break-even point Positive manning 1. The positive and negative aspects of a firm or operation H. Most important variables for an operation Economic Order Quantity (EOQ) Yield management G. A technique to determine the manpower requirement 1. Quality indicator of a service operation KANO analysis K The optimum level of re-order quantity Key Performance Indicators (KPI) L Seperation of front and back office Fish-bone diagram M. A method to determine what the customer wants and how we can respond to these demands

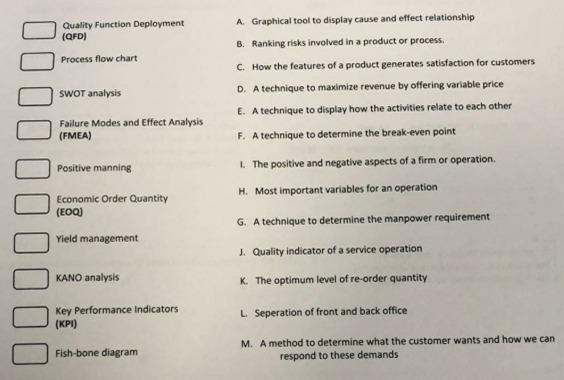
Step by Step Solution

There are 3 Steps involved in it

1 Expert Approved Answer
Step: 1 Unlock blur-text-image
Question Has Been Solved by an Expert!

Get step-by-step solutions from verified subject matter experts

Step: 2 Unlock
Step: 3 Unlock

Students Have Also Explored These Related General Management Questions!