

Question: match the graphs with the matching Match each graph (A-E) with the description which best describes the relationship A. B r = 0.10 r =
match the graphs with the matching
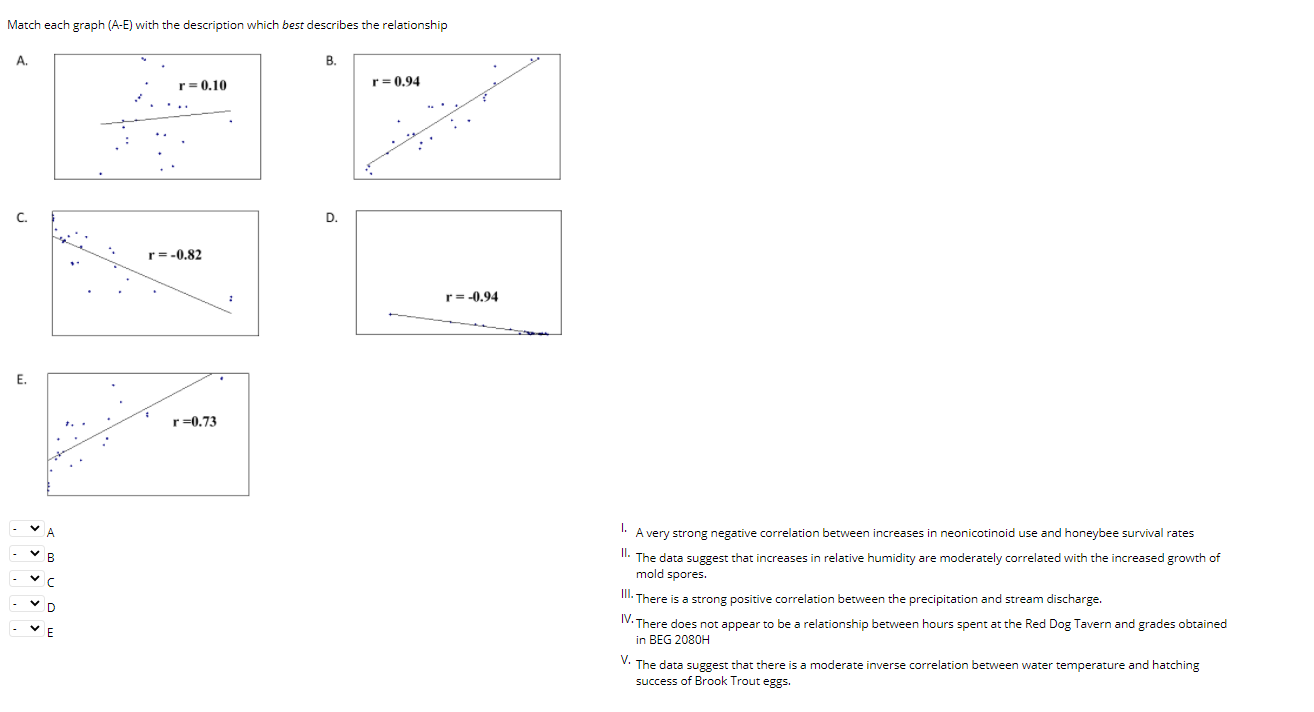
Match each graph (A-E) with the description which best describes the relationship A. B r = 0.10 r = 0.94 C. D. r=-0.82 r = -0.94 E. r=0.73 JA . A very strong negative correlation between increases in neonicotinoid use and honeybee survival rates ". The data suggest that increases in relative humidity are moderately correlated with the increased growth of C mold spores. I. There is a strong positive correlation between the precipitation and stream discharge. IV. There does not appear to be a relationship between hours spent at the Red Dog Tavern and grades obtained in BEG 2080H V. The data suggest that there is a moderate inverse correlation between water temperature and hatching success of Brook Trout eggs
Step by Step Solution
There are 3 Steps involved in it

Get step-by-step solutions from verified subject matter experts