

Question: Matching Cost Behavior Descriptions to Cost Behavior Graphs Select the graph (A through K) that best matches the numbered (1 through 6) descriptions of various
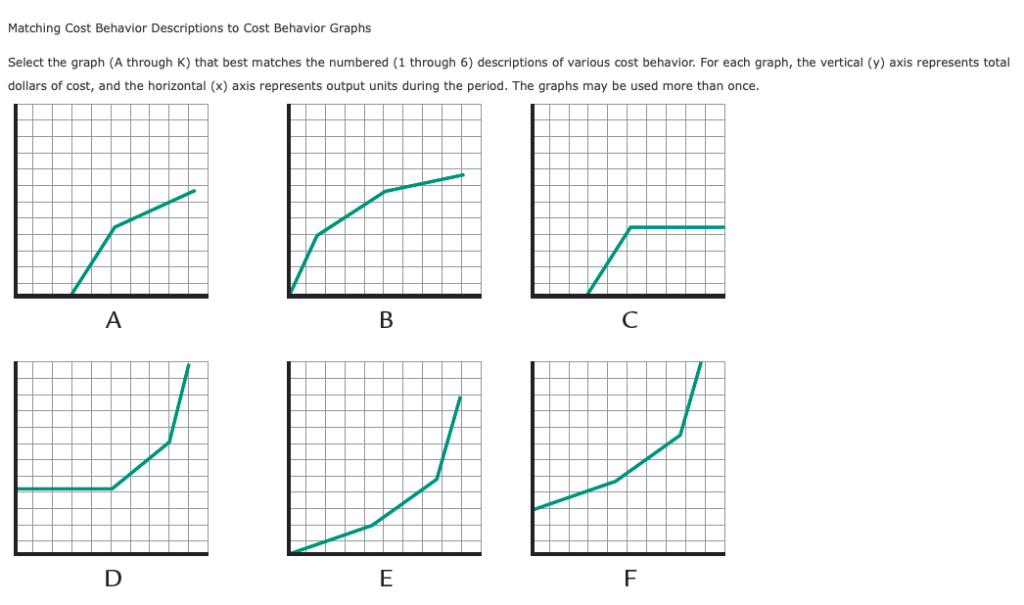
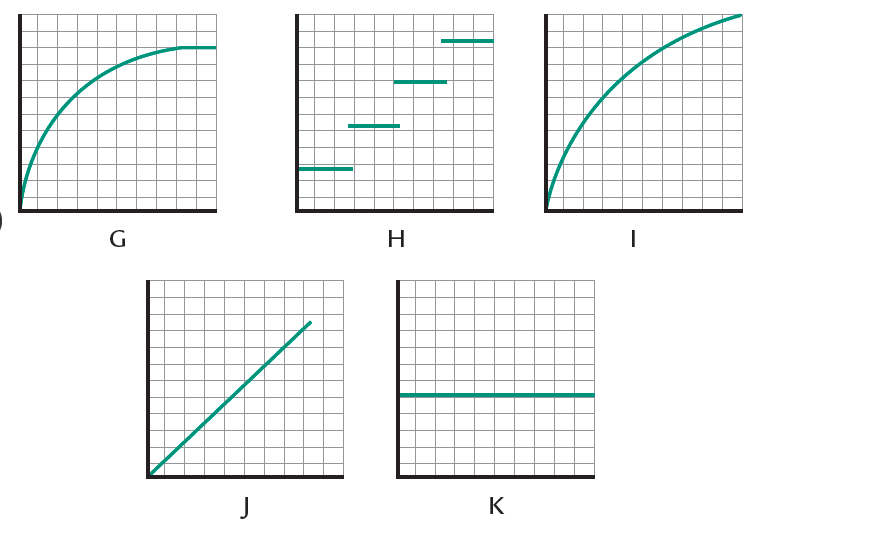
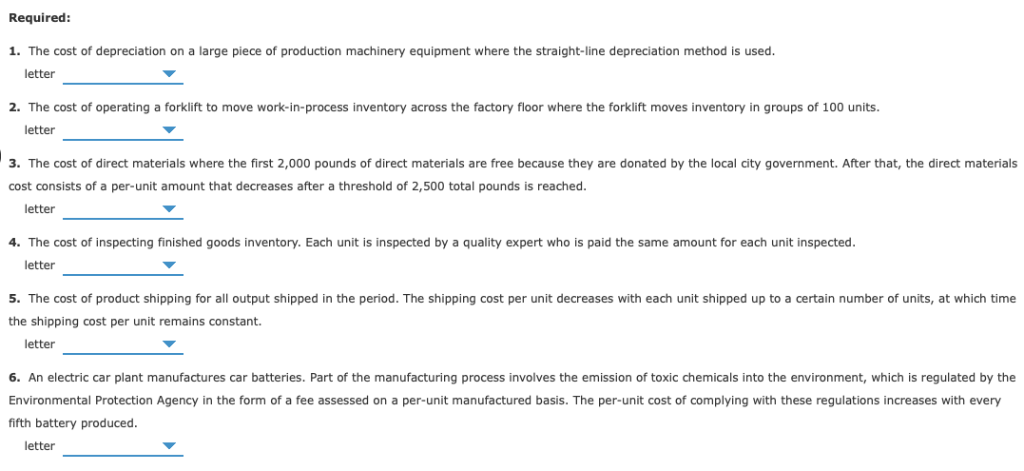
Matching Cost Behavior Descriptions to Cost Behavior Graphs Select the graph (A through K) that best matches the numbered (1 through 6) descriptions of various cost behavior. For each graph, the vertical (y) axis represents total dollars of cost, and the horizontal (x) axis represents output units during the period. The graphs may be used more than once
Step by Step Solution
There are 3 Steps involved in it
1 Expert Approved Answer
Step: 1 Unlock

Question Has Been Solved by an Expert!
Get step-by-step solutions from verified subject matter experts
Step: 2 Unlock
Step: 3 Unlock