

Question: Identify Cost Graphs The following cost graphs illustrate various types of cost behavior: Cost Graph One Cost Graph Three Cost Graph Two Cost Graph Four
Identify Cost Graphs
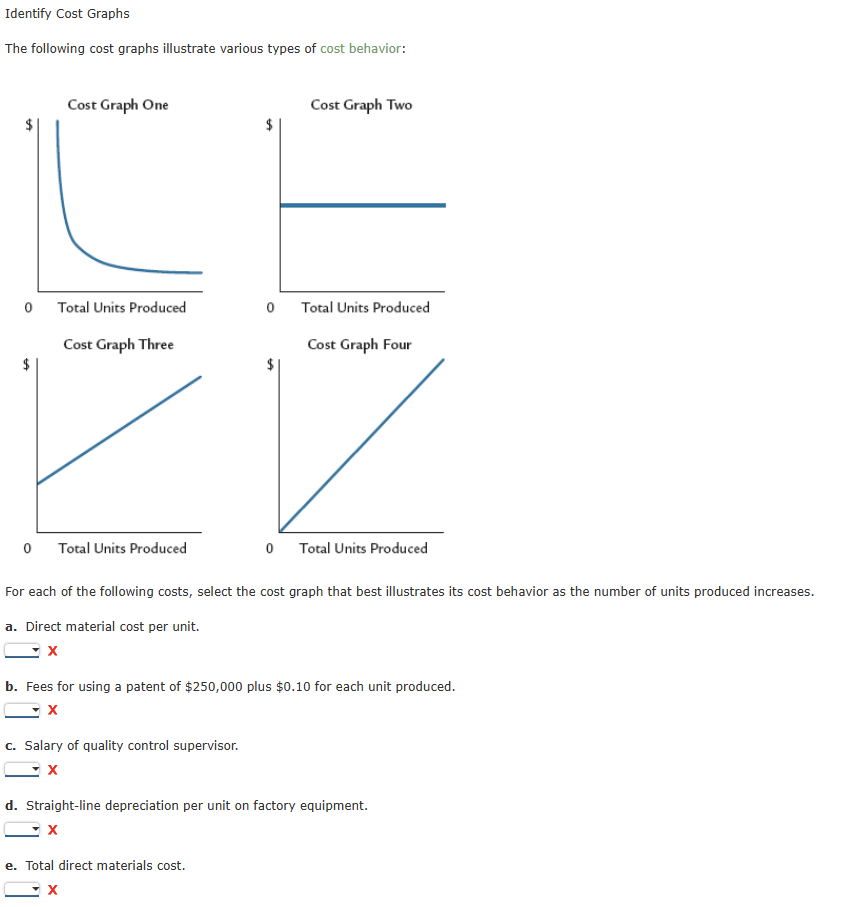
The following cost graphs illustrate various types of cost behavior:
Cost Graph One
Cost Graph Three
Cost Graph Two
Cost Graph Four
For each of the following costs, select the cost graph that best illustrates its cost behavior as the number of units produced increases.
a Direct material cost per unit.
mathbfx
b Fees for using a patent of $ plus $ for each unit produced.
X
c Salary of quality control supervisor.
mathbfX
d Straightline depreciation per unit on factory equipment.
e Total direct materials cost.
Step by Step Solution
There are 3 Steps involved in it
1 Expert Approved Answer
Step: 1 Unlock

Question Has Been Solved by an Expert!
Get step-by-step solutions from verified subject matter experts
Step: 2 Unlock
Step: 3 Unlock