

Question: Materiality (7 Points Each) Using the materiality guidelines below, calculate CVS materiality. Materiality CVS 2018 Materiality CVS 2017 - illustrative Case Materiality Guidelines One of
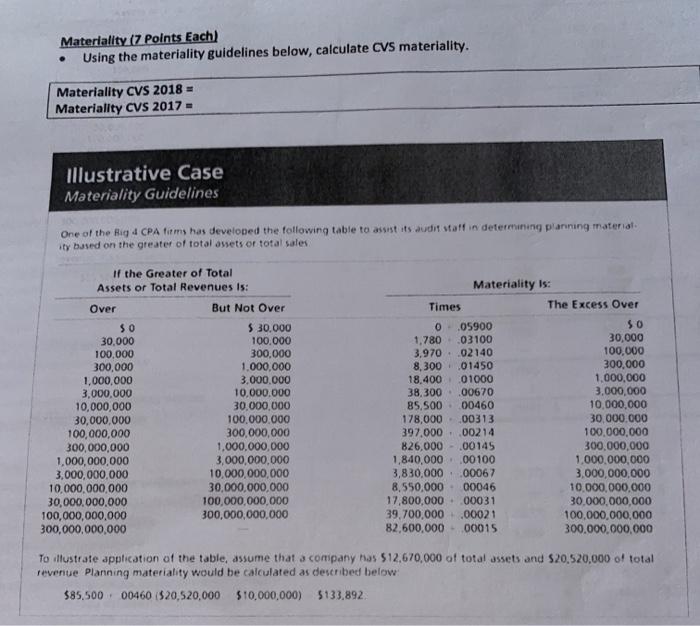
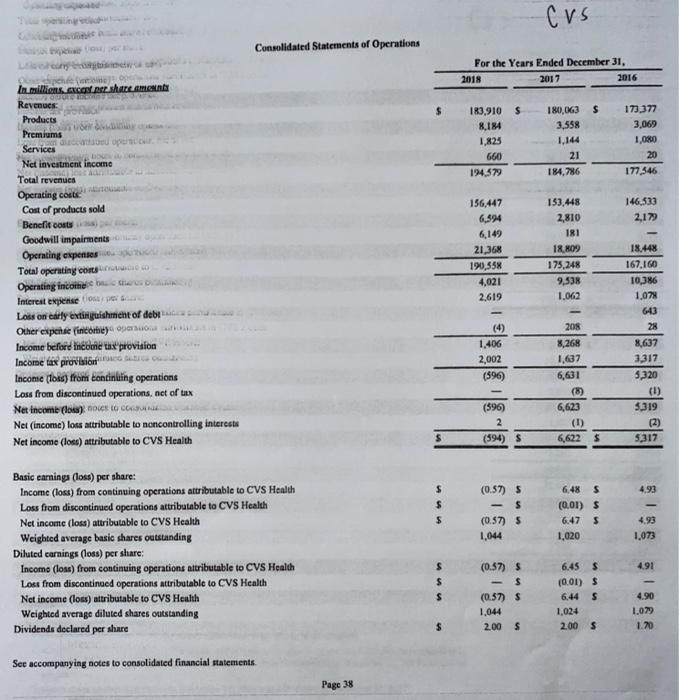
Materiality (7 Points Each) Using the materiality guidelines below, calculate CVS materiality. Materiality CVS 2018 Materiality CVS 2017 - illustrative Case Materiality Guidelines One of the Big 4 CPA firms has developed the following table to assist its audit staff in determining planning material ity bused on the greater of total assets or total sales If the Greater of Total Assets or Total Revenues is: Over SO 30.000 100.000 300,000 1,000,000 3,000,000 10,000,000 30,000,000 100,000,000 300,000,000 1,000,000,000 3,000,000,000 10,000,000,000 30,000,000,000 100,000,000,000 300,000,000,000 But Not Over $ 30.000 100.000 300,000 1.000.000 3.000.000 10.000.000 30.000.000 100.000.000 300,000,000 1.000.000.000 3,000,000,000 10,000,000,000 30,000,000,000 100,000,000,000 300,000,000,000 Materiality is: Times The Excess Over 0.05900 $0 1,780 03100 30,000 3.970 02140 100,000 8,300 .01450 300.000 18.400 01000 1,000,000 38.300.00670 3,000,000 85,500.00460 10,000,000 178,000.00313 30.000.000 397,000 00214 100,000,000 826,000 - .00145 300,000,000 1,840,000.00100 1.000.000.000 3,830,000.00067 3,000,000,000 8,550,000 00046 10,000,000,000 17,800,000 00031 30,000,000,000 39.700.000.00021 100,000,000,000 82,600,000 00015 300,000,000,000 To illustrate application of the table, assume that a company has $12,670,000 of total assets and S20,520,000 of total revenue Planning materiality would be calculated as described below: $85,500.00460 ($20,520,000 $10,000,000) $133.892 cus Consolidated Statements of Operations For the Years Ended December 31, 2018 2017 2016 $ $ 183,910 S 8.184 1,825 180,063 3,558 173377 3,069 1,080 20 177,346 660 194.579 21 184,786 156,447 6,594 146,533 2,172 In millions. Y por share am Revenues Products Premiums Services Net investment income Total revenues Operating costs Cost of products sold Benefit Cost Goodwill impairments Operating expenses Total operating costs Operating income Interest expenses Loss on early extinguishment of debt Other expense indottiero Income beford Income tax provision Income tax provision Income (los) for continuing operations Loss from discontinued operations, net of tax Net income one to co Net (income) loss attributable to noncontrolling interests Net income (los) attributable to CVS Health 21,368 190,558 4,021 2.619 153,448 2,810 181 18,809 175,248 9,538 1.062 1,406 2,002 (596) 208 8,268 1.637 6,631 (8) 6,623 18.448 167.160 10,386 1,078 643 28 8,637 3,317 5,320 (1) 5319 (2) $317 (596) 2 (594) $ (1) 6,622 $ 4,93 $ $ $ (0.57) 5 $ (0.57) 5 1,044 6.48 $ (0.01) $ 6.47 $ 1,020 4.93 1,073 Basic earning (loss) per share: Income (loss) from continuing operations attributable to CVS Health Loss from discontinued operations attributable to CVS Health Net income (loss) attributable to CVS Health Weighted average basic shares outstanding Diluted curnings (loss) per share: Income (los) from continuing operations attributable to CVS Health Lost from discontinued operations attributable to CVS Health Net income (los) attributable to CVS Health Weighted average diluted shares outstanding Dividends declared per share 4.91 $ $ $ (0.57) S $ (0.57) $ 1.044 2.00 $ 6.45 $ (0.01) $ s 1,024 2.00 $ 4.90 1.079 1.70 $ See accompanying notes to consolidated financial statements Page 38 Materiality (7 Points Each) Using the materiality guidelines below, calculate CVS materiality. Materiality CVS 2018 Materiality CVS 2017 - illustrative Case Materiality Guidelines One of the Big 4 CPA firms has developed the following table to assist its audit staff in determining planning material ity bused on the greater of total assets or total sales If the Greater of Total Assets or Total Revenues is: Over SO 30.000 100.000 300,000 1,000,000 3,000,000 10,000,000 30,000,000 100,000,000 300,000,000 1,000,000,000 3,000,000,000 10,000,000,000 30,000,000,000 100,000,000,000 300,000,000,000 But Not Over $ 30.000 100.000 300,000 1.000.000 3.000.000 10.000.000 30.000.000 100.000.000 300,000,000 1.000.000.000 3,000,000,000 10,000,000,000 30,000,000,000 100,000,000,000 300,000,000,000 Materiality is: Times The Excess Over 0.05900 $0 1,780 03100 30,000 3.970 02140 100,000 8,300 .01450 300.000 18.400 01000 1,000,000 38.300.00670 3,000,000 85,500.00460 10,000,000 178,000.00313 30.000.000 397,000 00214 100,000,000 826,000 - .00145 300,000,000 1,840,000.00100 1.000.000.000 3,830,000.00067 3,000,000,000 8,550,000 00046 10,000,000,000 17,800,000 00031 30,000,000,000 39.700.000.00021 100,000,000,000 82,600,000 00015 300,000,000,000 To illustrate application of the table, assume that a company has $12,670,000 of total assets and S20,520,000 of total revenue Planning materiality would be calculated as described below: $85,500.00460 ($20,520,000 $10,000,000) $133.892 cus Consolidated Statements of Operations For the Years Ended December 31, 2018 2017 2016 $ $ 183,910 S 8.184 1,825 180,063 3,558 173377 3,069 1,080 20 177,346 660 194.579 21 184,786 156,447 6,594 146,533 2,172 In millions. Y por share am Revenues Products Premiums Services Net investment income Total revenues Operating costs Cost of products sold Benefit Cost Goodwill impairments Operating expenses Total operating costs Operating income Interest expenses Loss on early extinguishment of debt Other expense indottiero Income beford Income tax provision Income tax provision Income (los) for continuing operations Loss from discontinued operations, net of tax Net income one to co Net (income) loss attributable to noncontrolling interests Net income (los) attributable to CVS Health 21,368 190,558 4,021 2.619 153,448 2,810 181 18,809 175,248 9,538 1.062 1,406 2,002 (596) 208 8,268 1.637 6,631 (8) 6,623 18.448 167.160 10,386 1,078 643 28 8,637 3,317 5,320 (1) 5319 (2) $317 (596) 2 (594) $ (1) 6,622 $ 4,93 $ $ $ (0.57) 5 $ (0.57) 5 1,044 6.48 $ (0.01) $ 6.47 $ 1,020 4.93 1,073 Basic earning (loss) per share: Income (loss) from continuing operations attributable to CVS Health Loss from discontinued operations attributable to CVS Health Net income (loss) attributable to CVS Health Weighted average basic shares outstanding Diluted curnings (loss) per share: Income (los) from continuing operations attributable to CVS Health Lost from discontinued operations attributable to CVS Health Net income (los) attributable to CVS Health Weighted average diluted shares outstanding Dividends declared per share 4.91 $ $ $ (0.57) S $ (0.57) $ 1.044 2.00 $ 6.45 $ (0.01) $ s 1,024 2.00 $ 4.90 1.079 1.70 $ See accompanying notes to consolidated financial statements Page 38
Step by Step Solution
There are 3 Steps involved in it

Get step-by-step solutions from verified subject matter experts