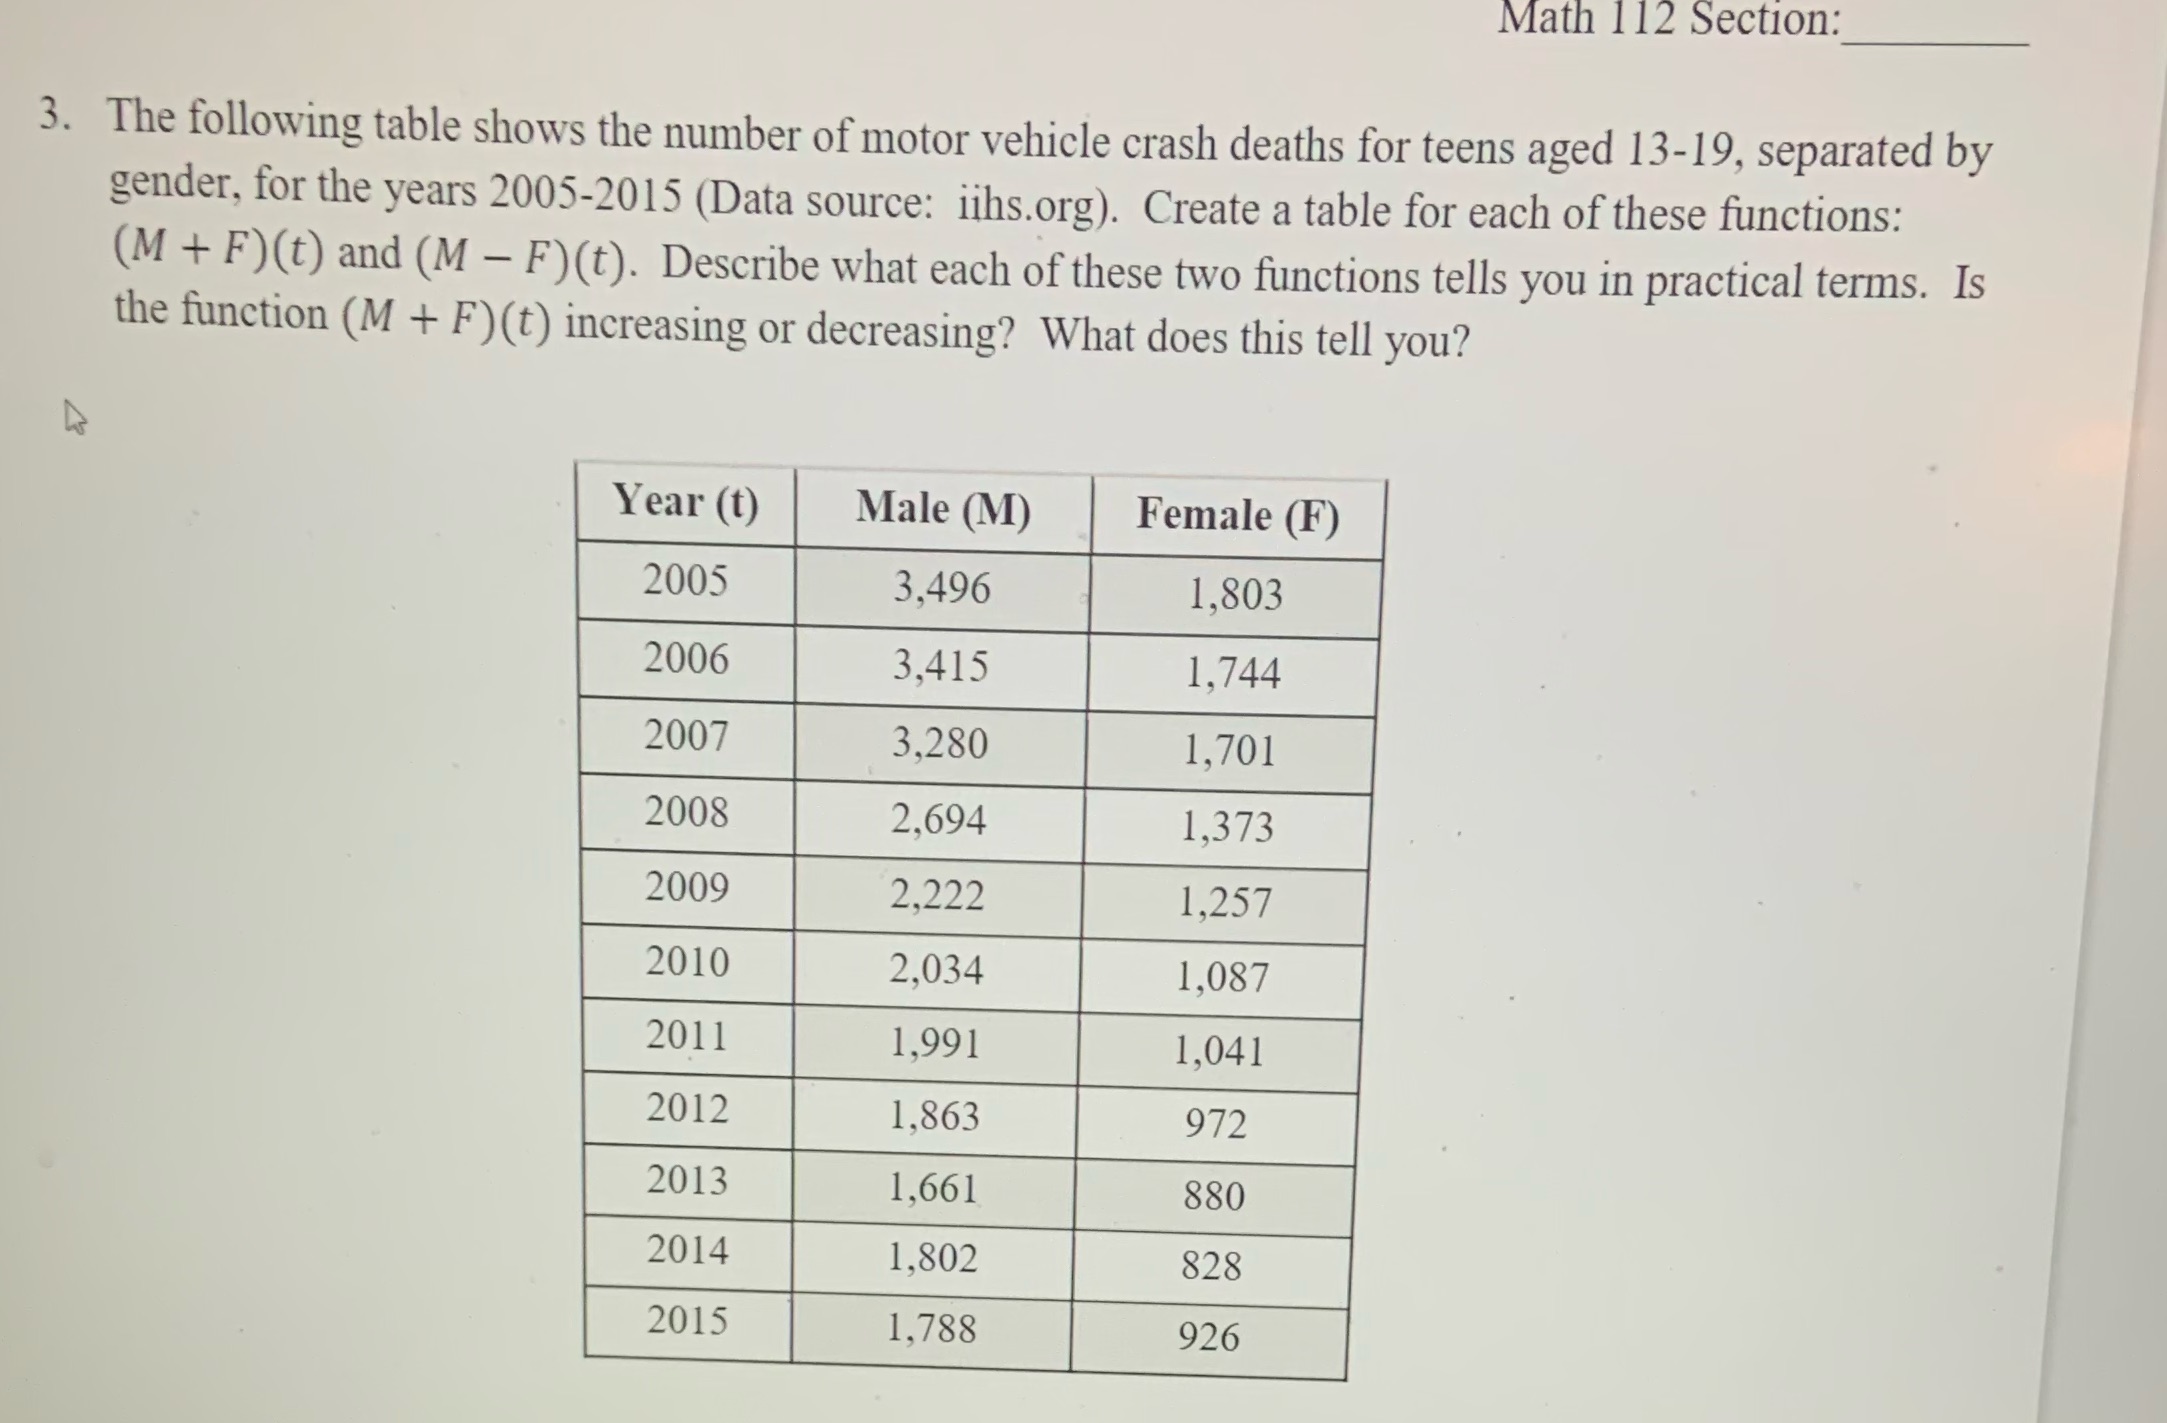
Question: Math 112 Section: 3. The following table shows the number of motor vehicle crash deaths for teens aged 13-19, separated by gender, for the years

Math 112 Section: 3. The following table shows
Math 112 Section: 3. The following table shows the number of motor vehicle crash deaths for teens aged 13-19, separated by gender, for the years 2005-2015 (Data source: iihs.org). Create a table for each of these functions: (M + F)(t) and (M - F)(t). Describe what each of these two functions tells you in practical terms. Is the function (M + F) (t) increasing or decreasing? What does this tell you? Year (t) Male (M) Female (F) 2005 3,496 1,803 2006 3,415 1,744 2007 3,280 1,701 2008 2,694 1,373 2009 2,222 1,257 2010 2,034 1,087 2011 1,991 1,041 2012 1,863 972 2013 1,661 880 2014 1,802 828 2015 1,788 926

Step by Step Solution

There are 3 Steps involved in it

1 Expert Approved Answer
Step: 1 Unlock blur-text-image
Question Has Been Solved by an Expert!

Get step-by-step solutions from verified subject matter experts

Step: 2 Unlock
Step: 3 Unlock

Students Have Also Explored These Related Mathematics Questions!