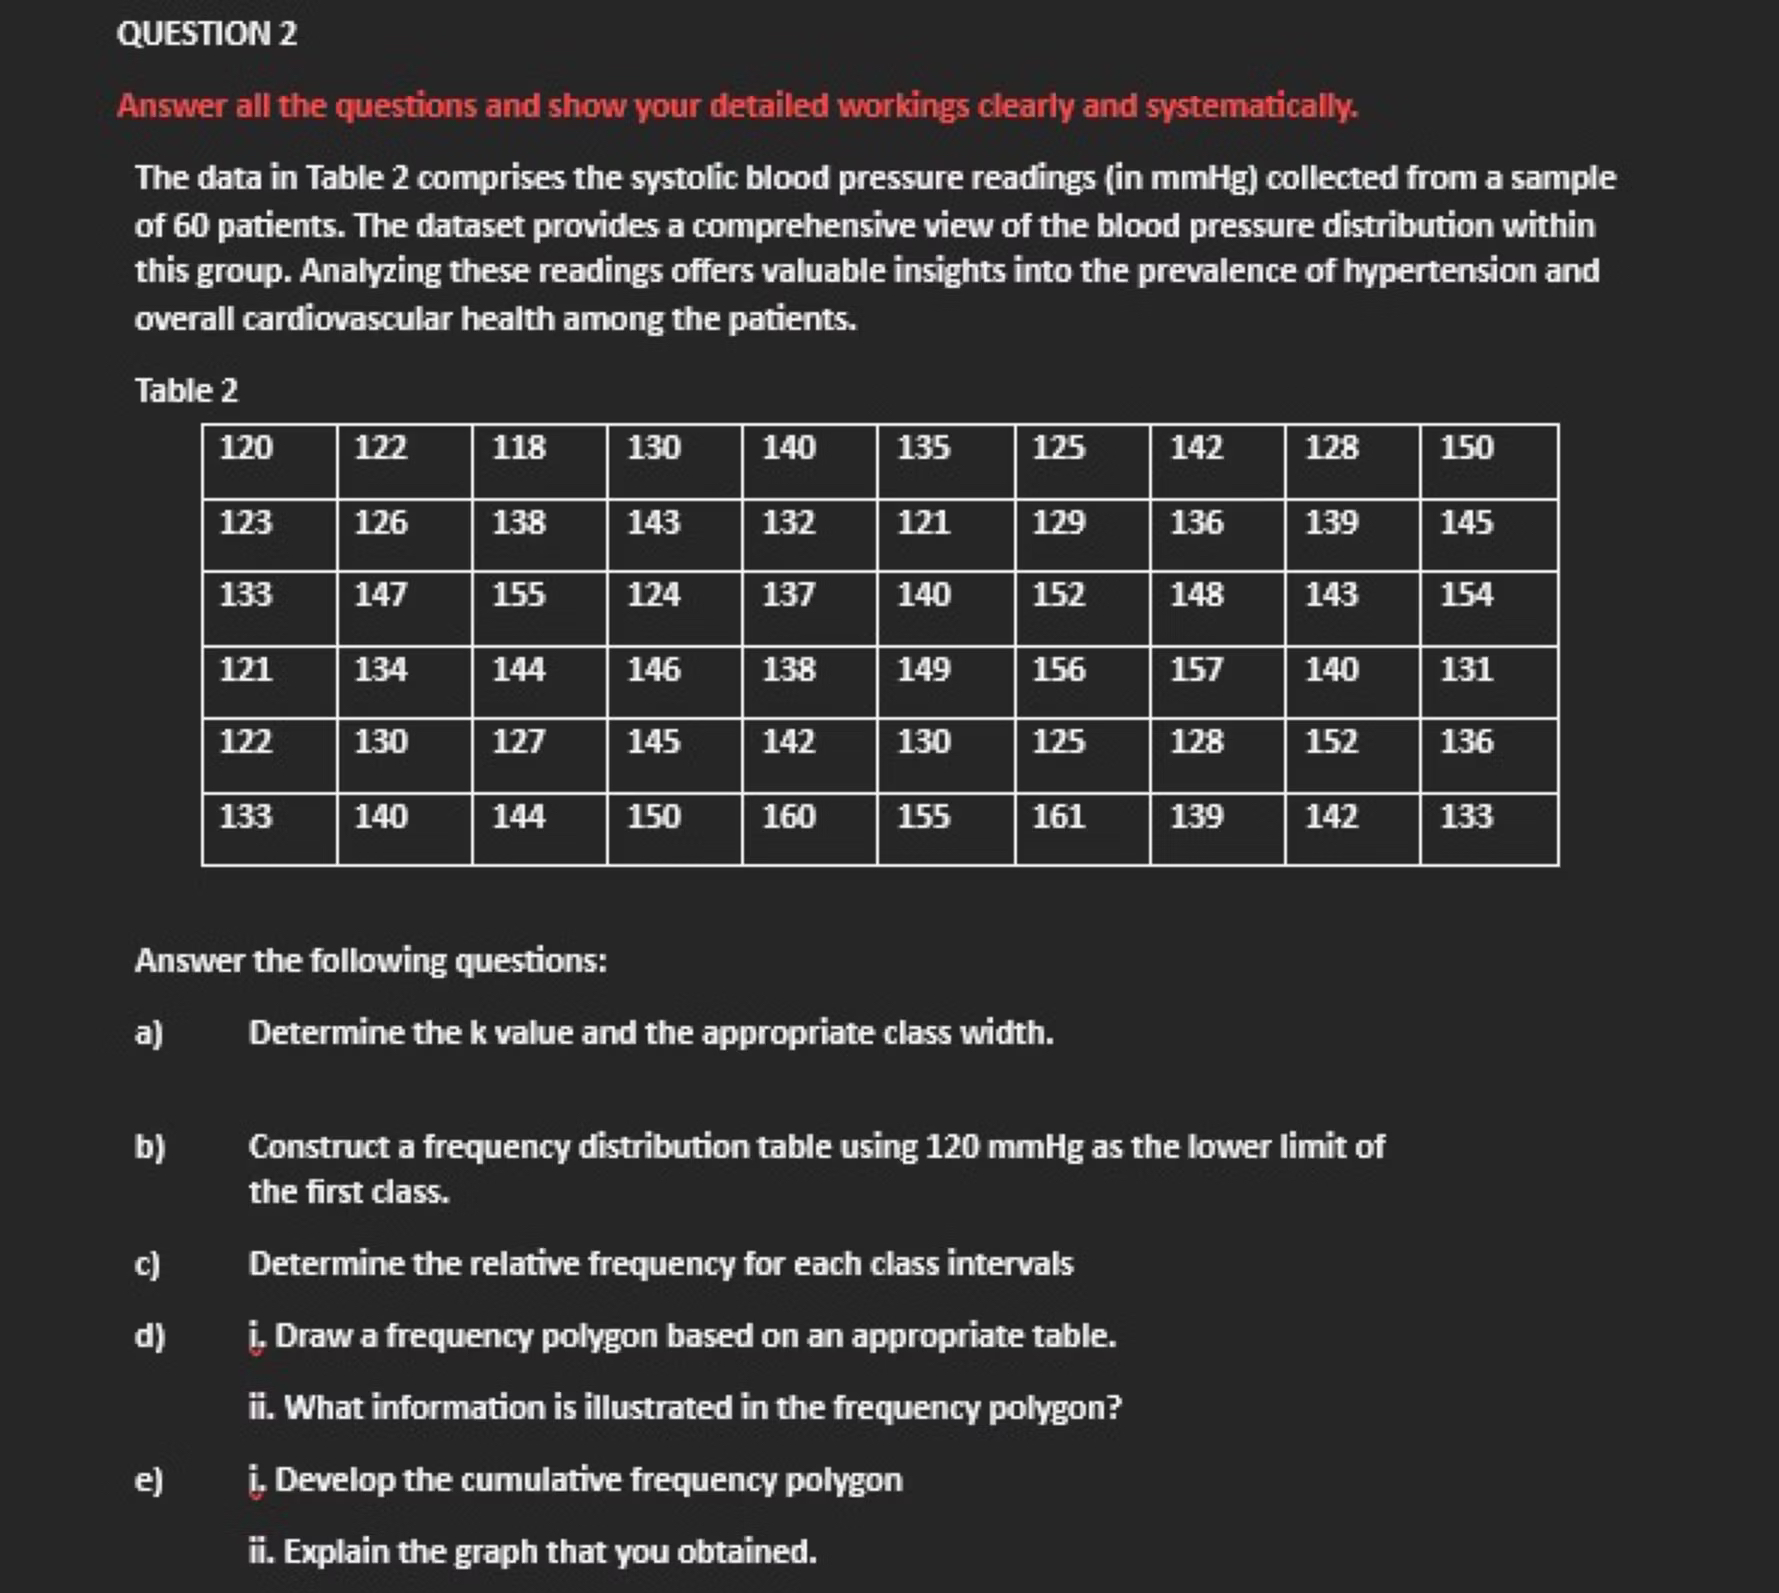
Question: QUESTION 2 The data in Table 2 comprises the systolic blood pressure readings (in mmHg) collected from a sample of 60 patients. The dataset provides

QUESTION 2 The data in Table 2 comprises the
QUESTION 2 The data in Table 2 comprises the systolic blood pressure readings (in mmHg) collected from a sample of 60 patients. The dataset provides a comprehensive view of the blood pressure distribution within this group. Analyzing these readings offers valuable insights into the prevalence of hypertension and overall cardiovascular health among the patients. L E1 Answer the following questions: 5l Determine the k value and the appropriate class width. b) Construct a frequency distribution table using 120 mmHg as the lower limit of the first dass. c) Determine the relative frequency for each class intervals ) i. Draw a frequency polygon based on an appropriate table. il. What information is illustrated in the frequency polygon? i. Develop the cumulative frequency polygon il. Explain the graph that you obtained

Step by Step Solution

There are 3 Steps involved in it

1 Expert Approved Answer
Step: 1 Unlock blur-text-image
Question Has Been Solved by an Expert!

Get step-by-step solutions from verified subject matter experts

Step: 2 Unlock
Step: 3 Unlock

Students Have Also Explored These Related Mathematics Questions!