

Question: Math 133: 4.2 Worksheet #4 Coursepack, p. 532 Name: Section #: 4.2: Least-Squares Regression 1. The following graph shows the relationship between contraceptive use and
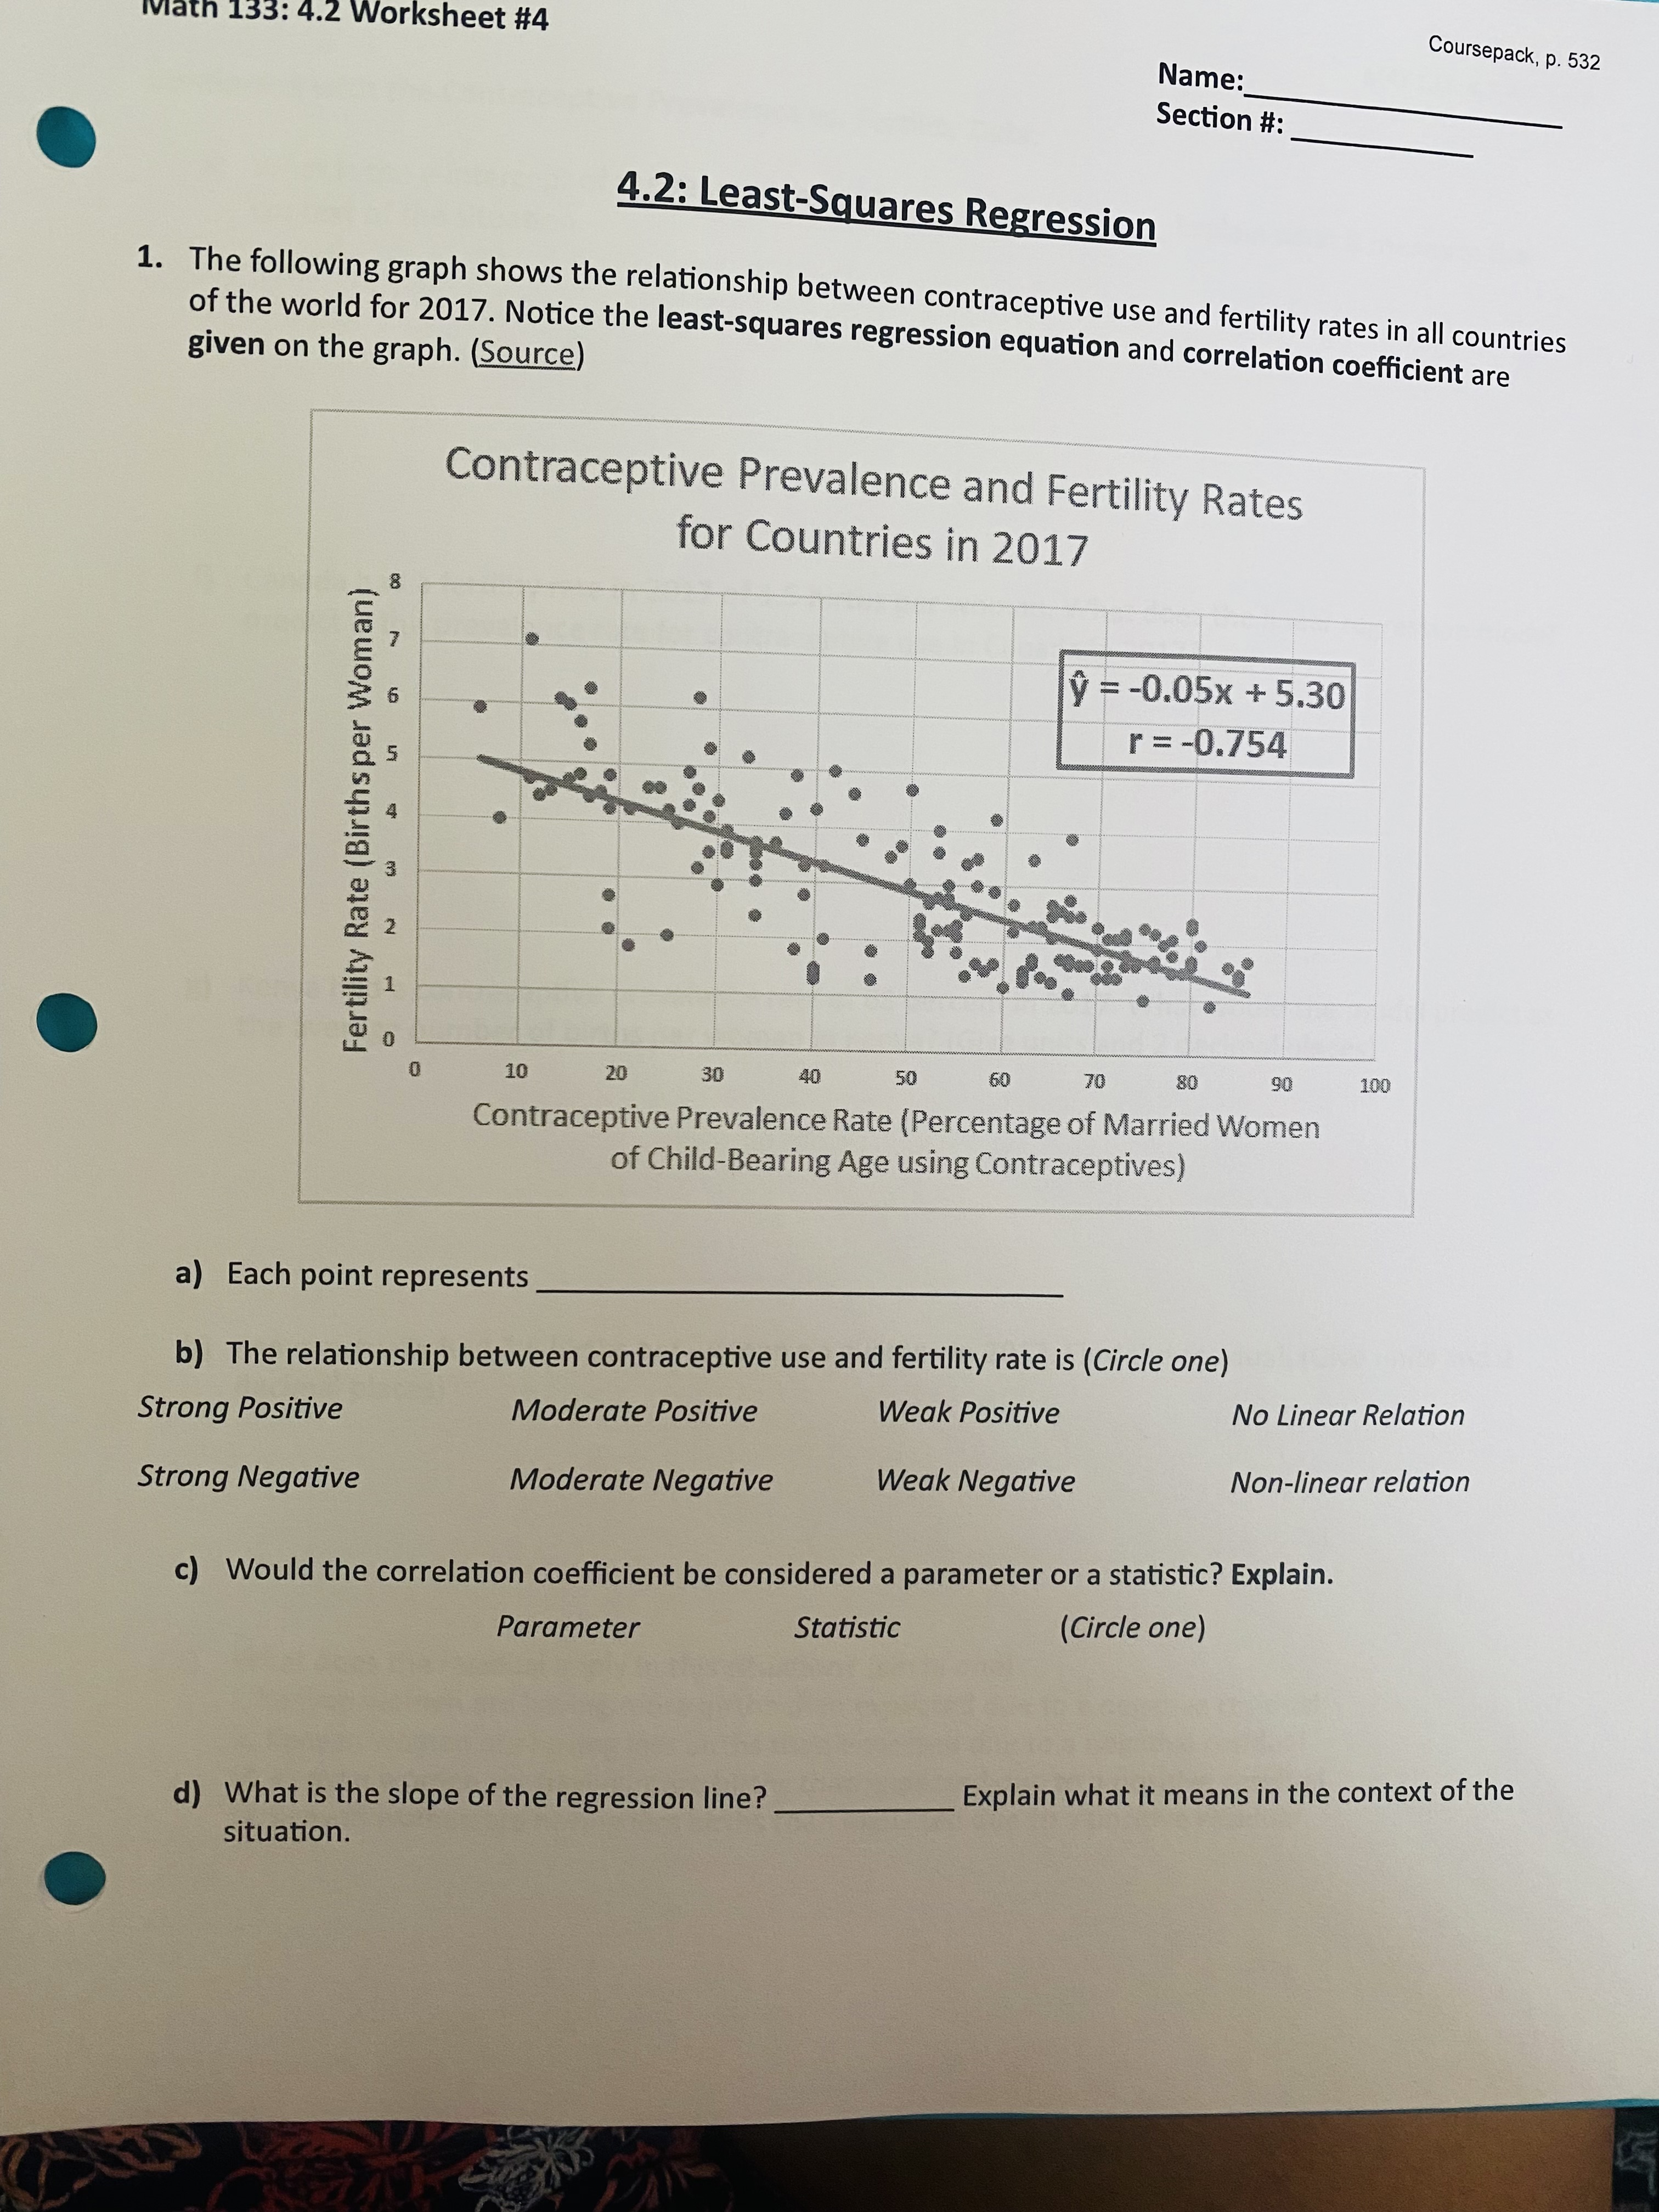

Math 133: 4.2 Worksheet #4 Coursepack, p. 532 Name: Section #: 4.2: Least-Squares Regression 1. The following graph shows the relationship between contraceptive use and fertility rates in all countries of the world for 2017. Notice the least-squares regression equation and correlation coefficient are given on the graph. (Source) Contraceptive Prevalence and Fertility Rates for Countries in 2017 y = -0.05x + 5.30 r =-0.754 Fertility Rate (Birthsper Woman) 10 20 30 40 50 70 80 90 100 Contraceptive Prevalence Rate (Percentage of Married Women of Child-Bearing Age using Contraceptives) a) Each point represents b) The relationship between contraceptive use and fertility rate is (Circle one) Strong Positive Moderate Positive Weak Positive No Linear Relation Strong Negative Moderate Negative Weak Negative Non-linear relation c) Would the correlation coefficient be considered a parameter or a statistic? Explain. Parameter Statistic (Circle one) d) What is the slope of the regression line? Explain what it means in the context of the situation.WS 4 p.2 Continuing with the Contraceptive Prevalence vs. Fertility Data: e) What is the y-intercept of the regression line? context of the situation. Explain what it means in the f) Canada had a fertility rate in 2017 of 1.5 births per woman. What does the linear regression model predict is the prevalence rate for contraceptive use in Canada in 2017? g) Kenya had a contraceptive prevalence rate of 63 percent in 2017. What would the model predict as the average number of births per woman in Kenya? (Give units and 2 decimal places) h) Kenya actually had 3.5 births per woman on average in 2017. Find the residual. (Give units and 2 decimal places) i) What does the residual imply in this situation? (circle one) i. Kenyan women are having more births than expected due to a negative residual ii. Kenyan women are having less births than expected due to a negative residual iii. Kenyan women are having more births than expected due to a positive residual iv. Kenyan women are having less births than expected due to a positive residual
Step by Step Solution
There are 3 Steps involved in it

Get step-by-step solutions from verified subject matter experts