

Question: Math 133: 4.2 Worksheet #4 Section #:_ 13:4.2 WS 4 4.2: Least-Squares Regression 1. The following graph shows the relationship between contraceptive use and fertility
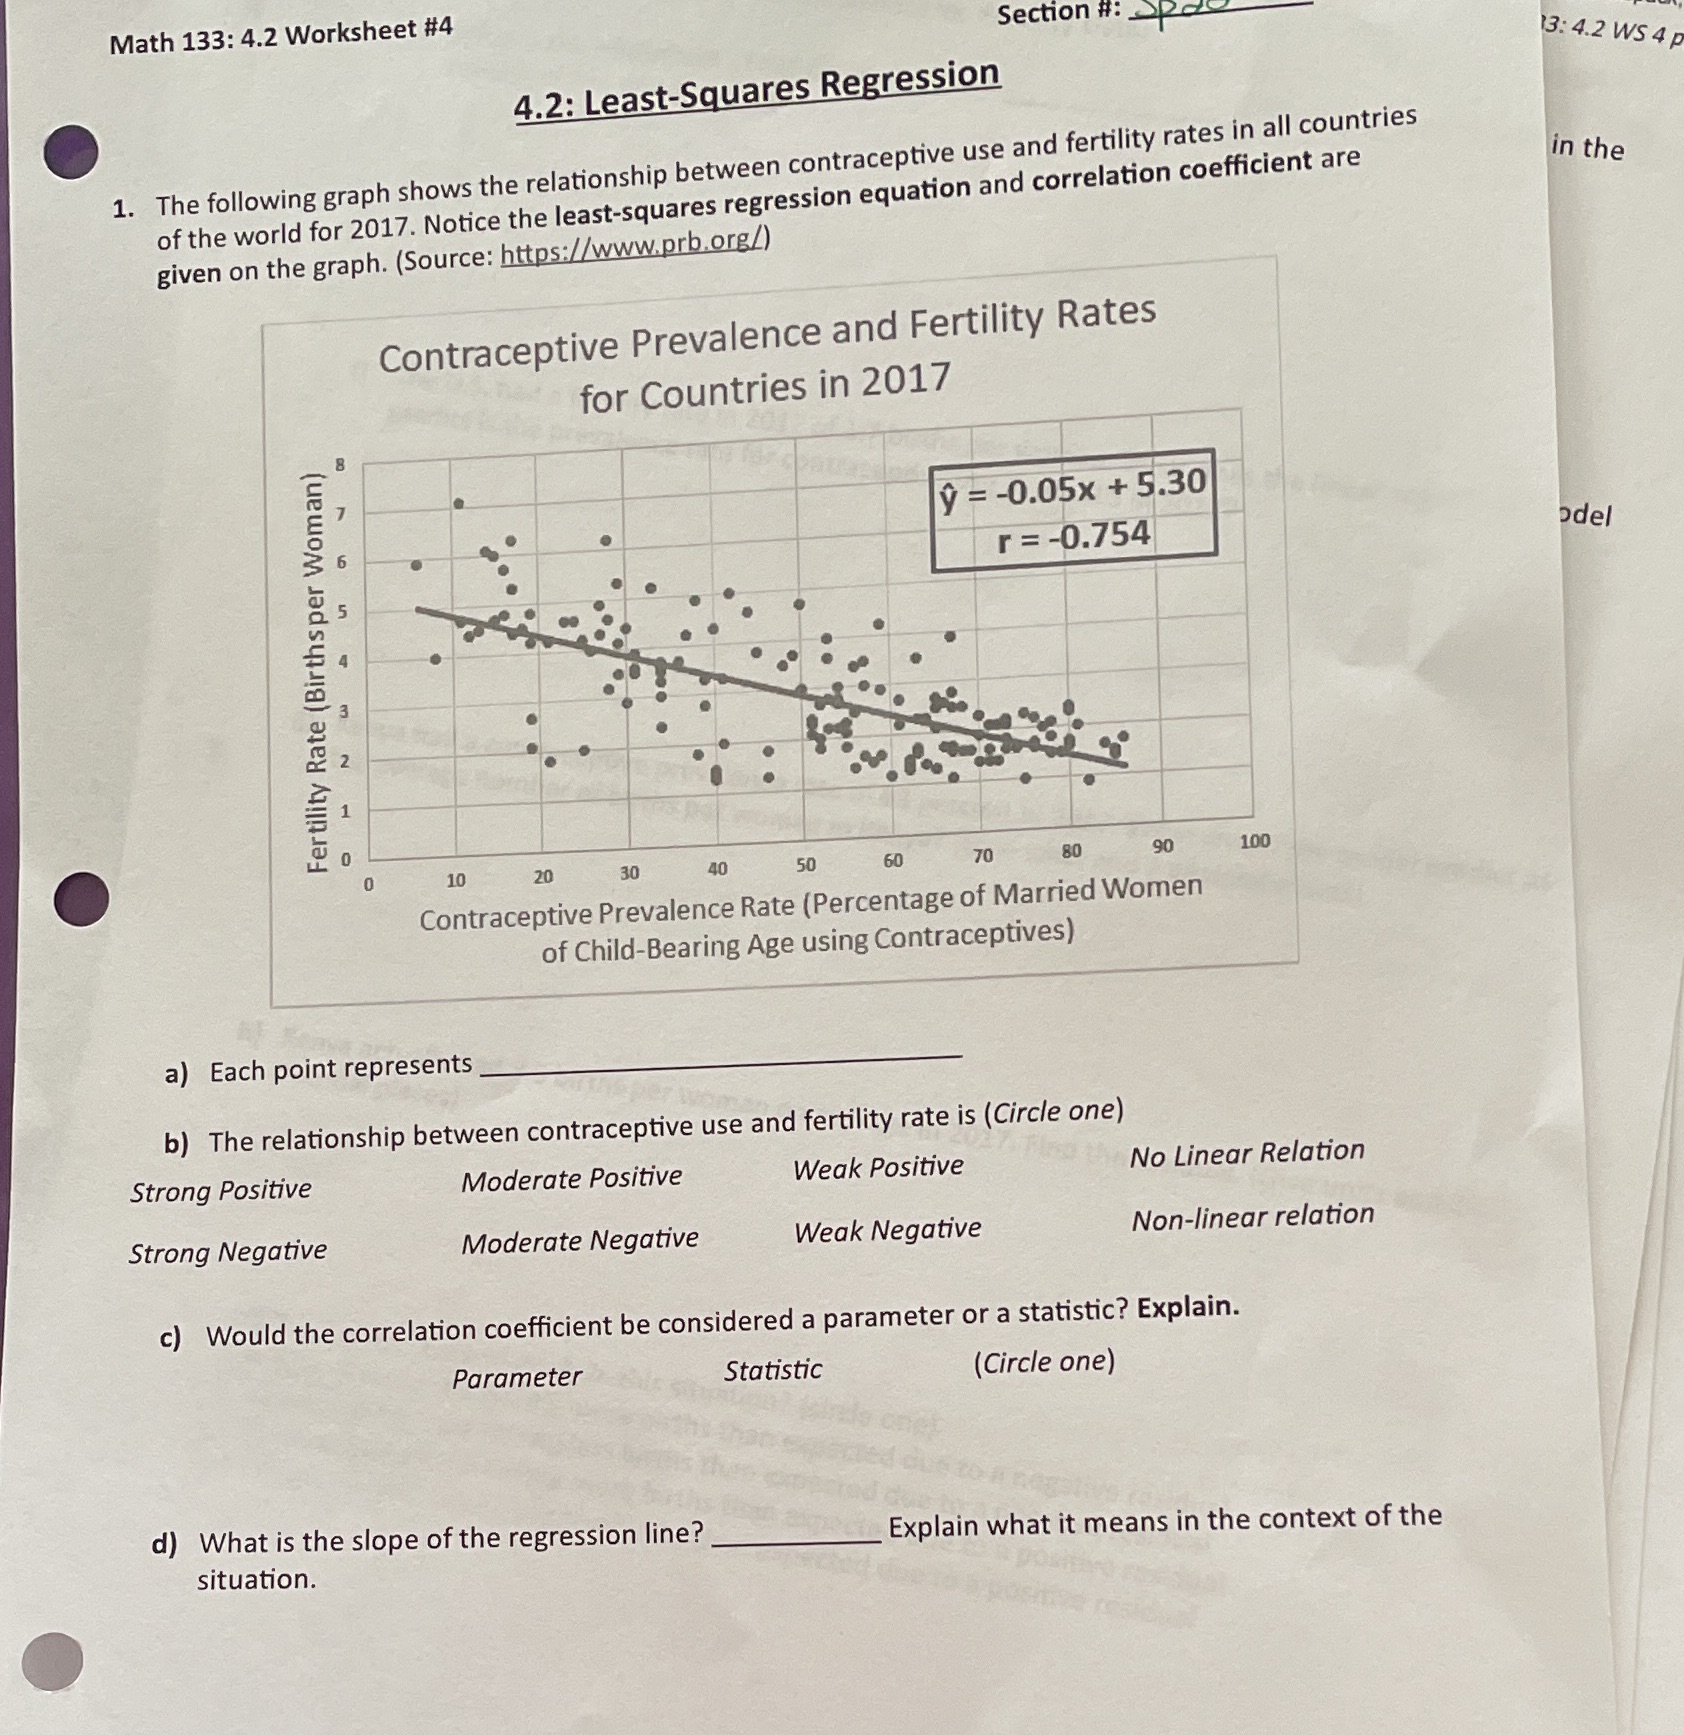
Math 133: 4.2 Worksheet #4 Section #:_ 13:4.2 WS 4 4.2: Least-Squares Regression 1. The following graph shows the relationship between contraceptive use and fertility rates in all countries in the of the world for 2017. Notice the least-squares regression equation and correlation coefficient are given on the graph. (Source: https://www.prb.org/) Contraceptive Prevalence and Fertility Rates for Countries in 2017 y = -0.05x + 5.30 r =-0.754 del Fertility Rate (Birthsper Woman) N 0 10 20 30 40 50 60 70 80 90 100 Contraceptive Prevalence Rate (Percentage of Married Women of Child-Bearing Age using Contraceptives) a) Each point represents b) The relationship between contraceptive use and fertility rate is (Circle one) Strong Positive Moderate Positive Weak Positive No Linear Relation Strong Negative Moderate Negative Weak Negative Non-linear relation c) Would the correlation coefficient be considered a parameter or a statistic? Explain. Parameter Statistic (Circle one) d) What is the slope of the regression line? Explain what it means in the context of the situation
Step by Step Solution
There are 3 Steps involved in it

Get step-by-step solutions from verified subject matter experts