

Question: Math 133: Ch 4 Review Worksheet Name:_ Section #: Ch 4 Review Worksheet 1. The scatterplot below shows the relationship between the average fat intake

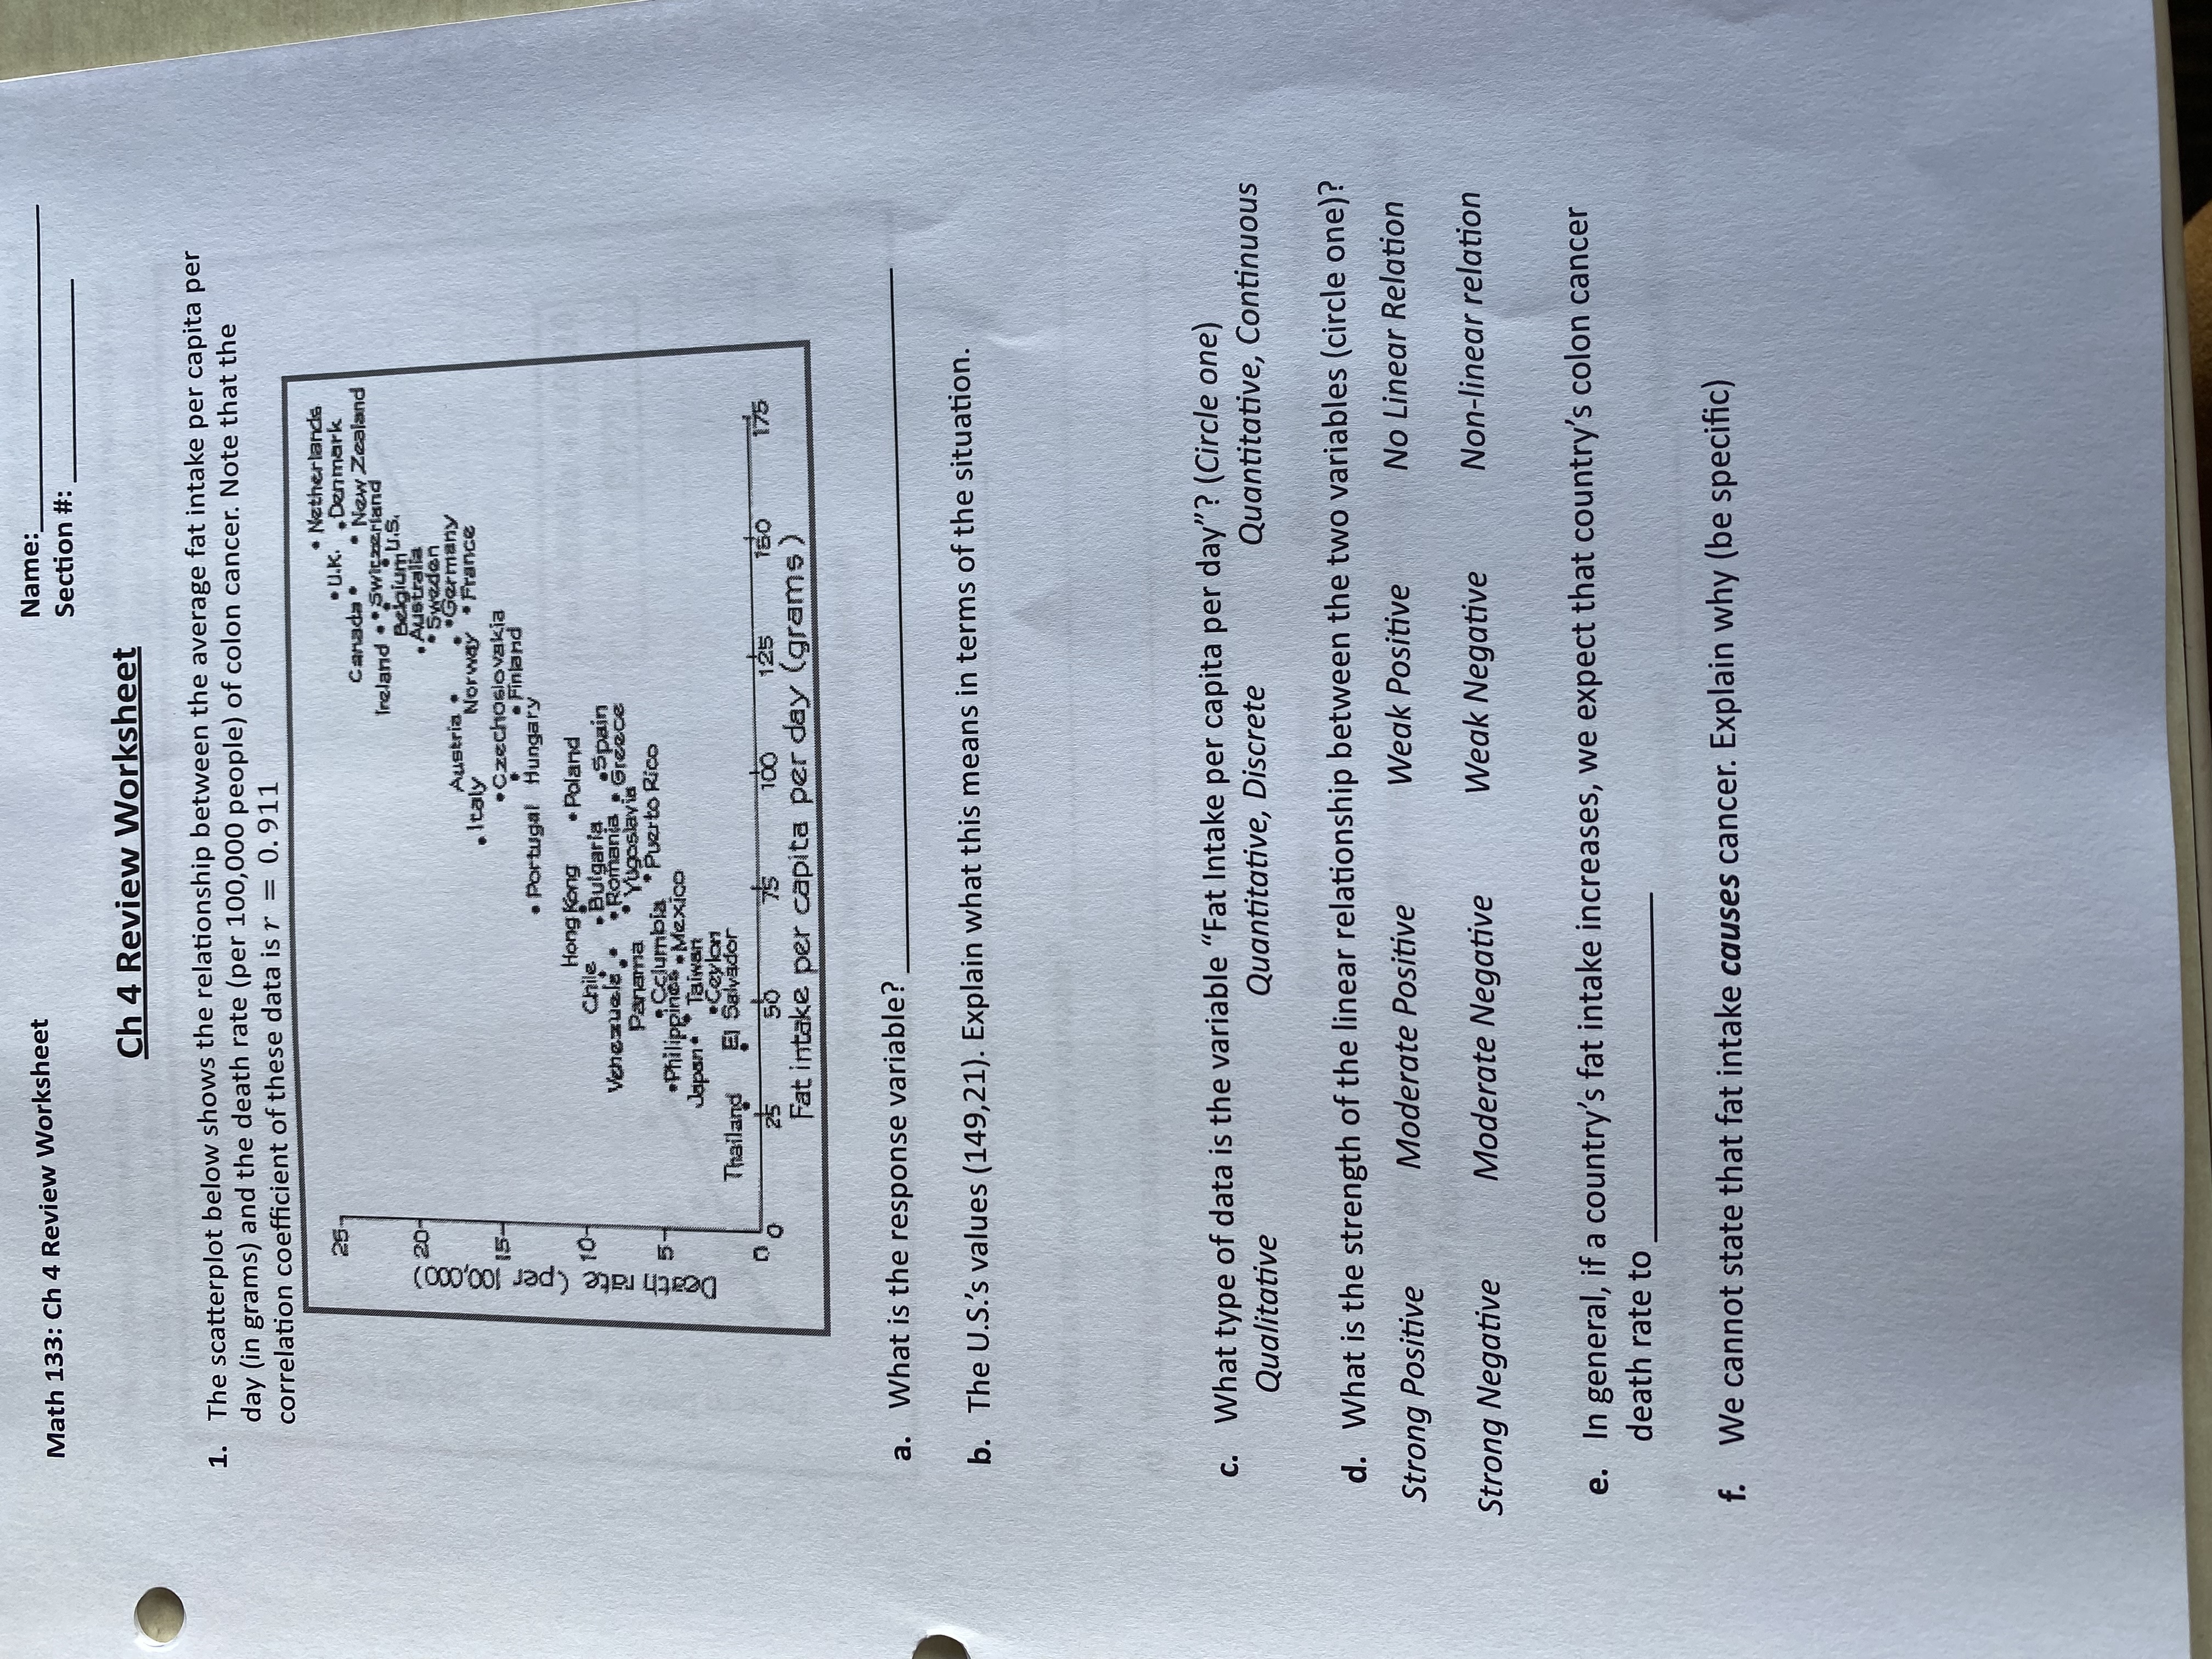
Math 133: Ch 4 Review Worksheet Name:_ Section #: Ch 4 Review Worksheet 1. The scatterplot below shows the relationship between the average fat intake per capita per day (in grams) and the death rate (per 100,000 people) of colon cancer. Note that the correlation coefficient of these data is r = 0. 911 25 . Netherlands . U.K. . Denmark Canada . New Zealand Ireland . * Switzerland 20 Belgium Australia Sweden Austria "Germany . Italy Norway . France 15- . Czechoslovakia Finland . Portugal Hungary" Death rate (per 100,000) Hong Kong . Poland Chile Bulgaria Venezuela.. .Spain Romania . Greece Panama Yugoslavia 5- Columbia Puerto Rico . Philippines . Mexico Japan . alwan ceylon Thailand El Salvador 50 100 125 175 Fat intake per capita per day (grams ) a. What is the response variable? b. The U.S.'s values (149,21). Explain what this means in terms of the situation. c. What type of data is the variable "Fat Intake per capita per day"? (Circle one) Qualitative Quantitative, Discrete Quantitative, Continuous d. What is the strength of the linear relationship between the two variables (circle one)? Strong Positive Moderate Positive Weak Positive No Linear Relation Strong Negative Moderate Negative Weak Negative Non-linear relation e. In general, if a country's fat intake increases, we expect that country's colon cancer death rate to f. We cannot state that fat intake causes cancer. Explain why (be specific)
Step by Step Solution
There are 3 Steps involved in it

Get step-by-step solutions from verified subject matter experts