

Question: MATH 1342 2021fa Section 36Q Written Lab Assignment #6 Name Tristan Abbe Due: Thursday, November 4, 2021 Grading using The Curve When grading using the
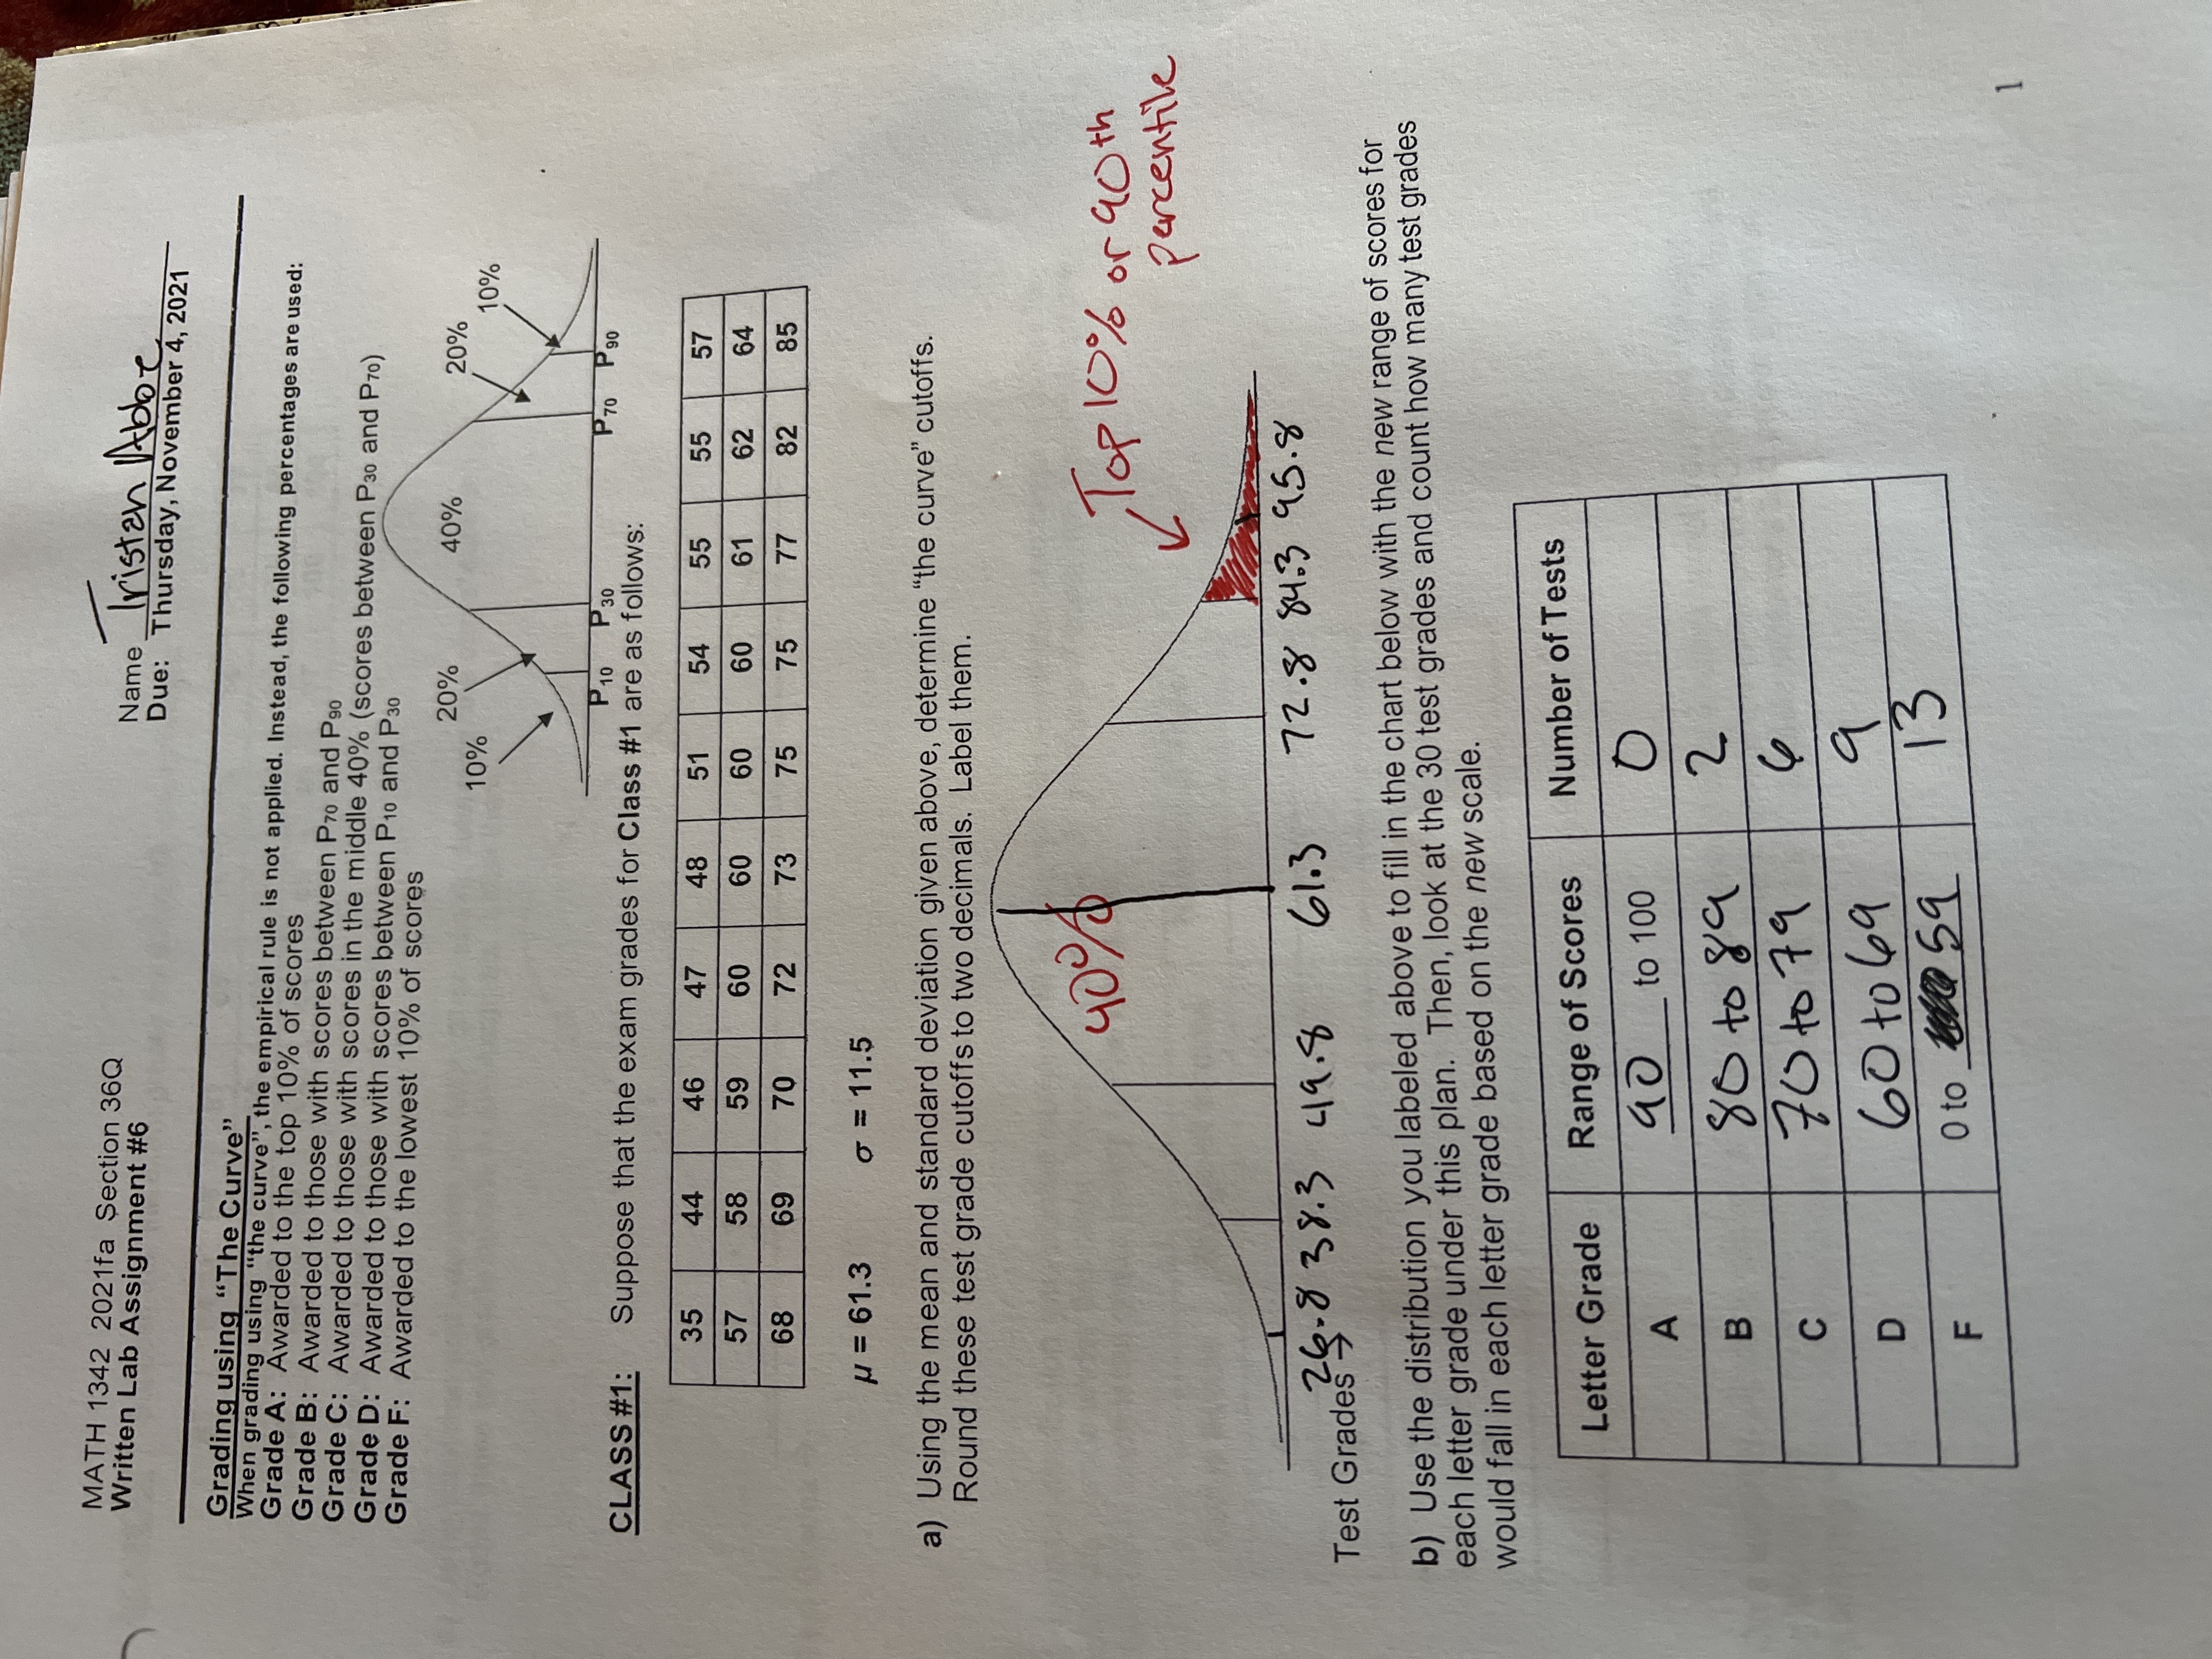
MATH 1342 2021fa Section 36Q Written Lab Assignment #6 Name Tristan Abbe Due: Thursday, November 4, 2021 Grading using "The Curve" When grading using "the curve", the empirical rule is not applied. Instead, the following percentages are used: Grade A: Awarded to the top 10% of scores Grade B: Awarded to those with scores between Pro and Pgo Grade C: Awarded to those with scores in the middle 40% (scores between Pao and P70) Grade D: Awarded to those with scores between P10 and P30 Grade F: Awarded to the lowest 10% of scores 20% 40% 10% 20% 10% P10 P 30 CLASS #1: Suppose that the exam grades for Class #1 are as follows: P70 35 44 46 47 48 51 54 55 55 57 57 58 59 60 60 60 60 61 62 64 68 69 70 72 73 75 75 77 82 85 M = 61.3 0 = 11.5 a) Using the mean and standard deviation given above, determine "the curve" cutoffs. Round these test grade cutoffs to two decimals. Label them. 40%% Top 10% or 90 th percentile Test Grades 26-8 38.3 49.8 61.3 72.8 84. 3 95.8 b) Use the distribution you labeled above to fill in the chart below with the new range of scores for each letter grade under this plan. Then, look at the 30 test grades and count how many test grades would fall in each letter grade based on the new scale. Letter Grade Range of Scores Number of Tests A 90 to 100 0 B 80 to 89 2 C 70 to 79 9 D 60 to 69 0 to mesa 13 F
Step by Step Solution
There are 3 Steps involved in it

Get step-by-step solutions from verified subject matter experts