

Question: Math 153 Correlation Analysis Match the following correlations to the graphs below 1= 0.91 r= 0.60 T=0 r= 0.70 1098 FW-0.45 2. The possible values

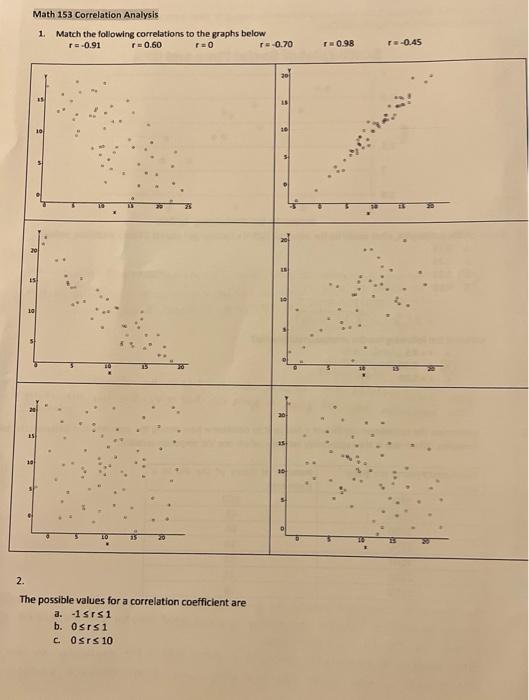
Math 153 Correlation Analysis Match the following correlations to the graphs below 1= 0.91 r= 0.60 T=0 r= 0.70 1098 FW-0.45 2. The possible values for a correlation coefficient are -isrs1 b. 0sr51 C Osrs 10
Step by Step Solution
There are 3 Steps involved in it
1 Expert Approved Answer
Step: 1 Unlock

Question Has Been Solved by an Expert!
Get step-by-step solutions from verified subject matter experts
Step: 2 Unlock
Step: 3 Unlock