

Question: Math 1680 FA 21(3) Trevon Stewa Homework: Section 4.2 ... HW Score: 32%, 2.56 of 8 points FA21(3) Homework: Section 4.2 ... Question 5, 4.2.21
Math 1680 FA 21(3) Trevon Stewa Homework: Section 4.2 ... HW Score: 32%, 2.56 of 8 points
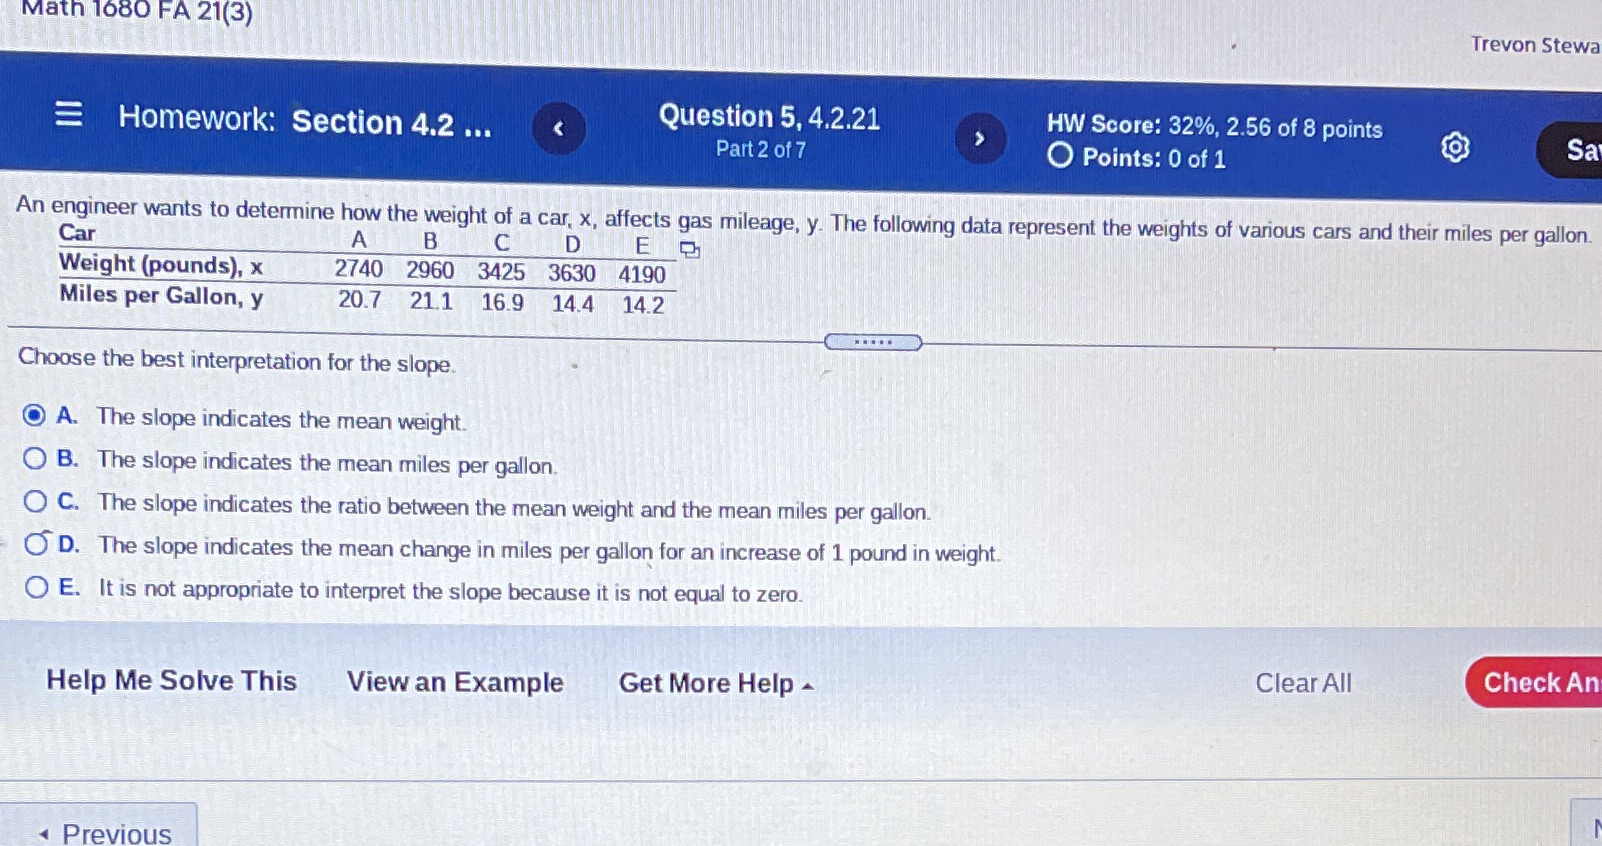
FA21(3) Homework: Section 4.2 ... Question 5, 4.2.21 Part 2 of 7 Trevon Stewa HW Score: 32%, 2.56 of 8 points O Points: O of 1 An engineer wants to determine how the vight of a car, x, affects gas mileage. y. The following data represent the ights of various cars and their miles per gallon. Weight (pounds), x 2740 2960 3425 3630 4190 Miles per Gallon, y 20.7 21.1 168 14.4 14.2 Ctxose the best interpretation for the @ A. The indicates the mean ight. O B. The slope indicates the mean miles per gallon. O C. The slope indicates the ratio betvveen the mean ight and the mean miles per gallon. CD. The slope indicates the mean change in miles per gallon for an increase of I pound in weight. O E. It is not appropriate to interpret the slope because it is not equal to zero. Help Me Solve This View an Example Get More Help Previous Clear All Check An
Step by Step Solution
There are 3 Steps involved in it

Get step-by-step solutions from verified subject matter experts