

Question: math 251 statistics Homework: Homework 1 Question 22, 2.4.7 HW Score: 0%, 0 of 45 points Part 1 of 2 O Points: 0 of 1
math 251 statistics
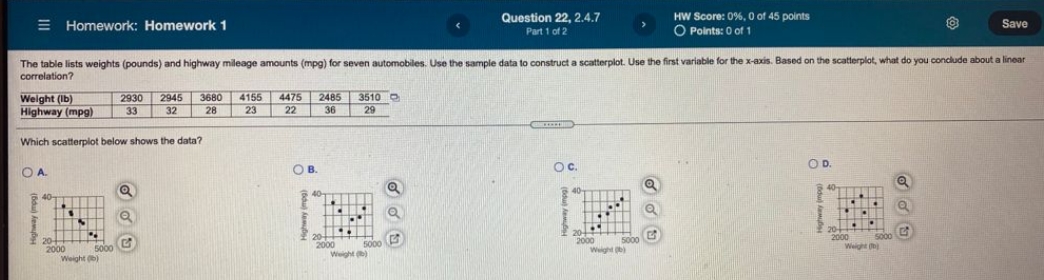
Homework: Homework 1 Question 22, 2.4.7 HW Score: 0%, 0 of 45 points Part 1 of 2 O Points: 0 of 1 Save The table lists weights (pounds) and highway mileage amounts (mpg) for seven automobiles. Use the sample data to construct a scatterplot. Use the first variable for the x-axis. Based on the scatterplot, what do you conclude about a linear correlation? Weight (1b) 2930 2945 3680 4155 4475 2485 3510 Highway (mpg) 33 32 28 23 22 36 29 Which scatterplot below shows the data? OA. OB OC. O D 40 Highway Impal Fughway impal Highway Impal Highway Impg) 20 20 20 5000 2000 5000 2000 5000 2000 5000 2000 weighttel Welghi pel Weight UDI
Step by Step Solution
There are 3 Steps involved in it

Get step-by-step solutions from verified subject matter experts