

Question: statistics Homework: Homework 9 Question 9, 9.2.42 HW Score: 36.43%, 7.29 of 20 points Part 1 of 3 Points: 0 of 1 Save Use the
statistics
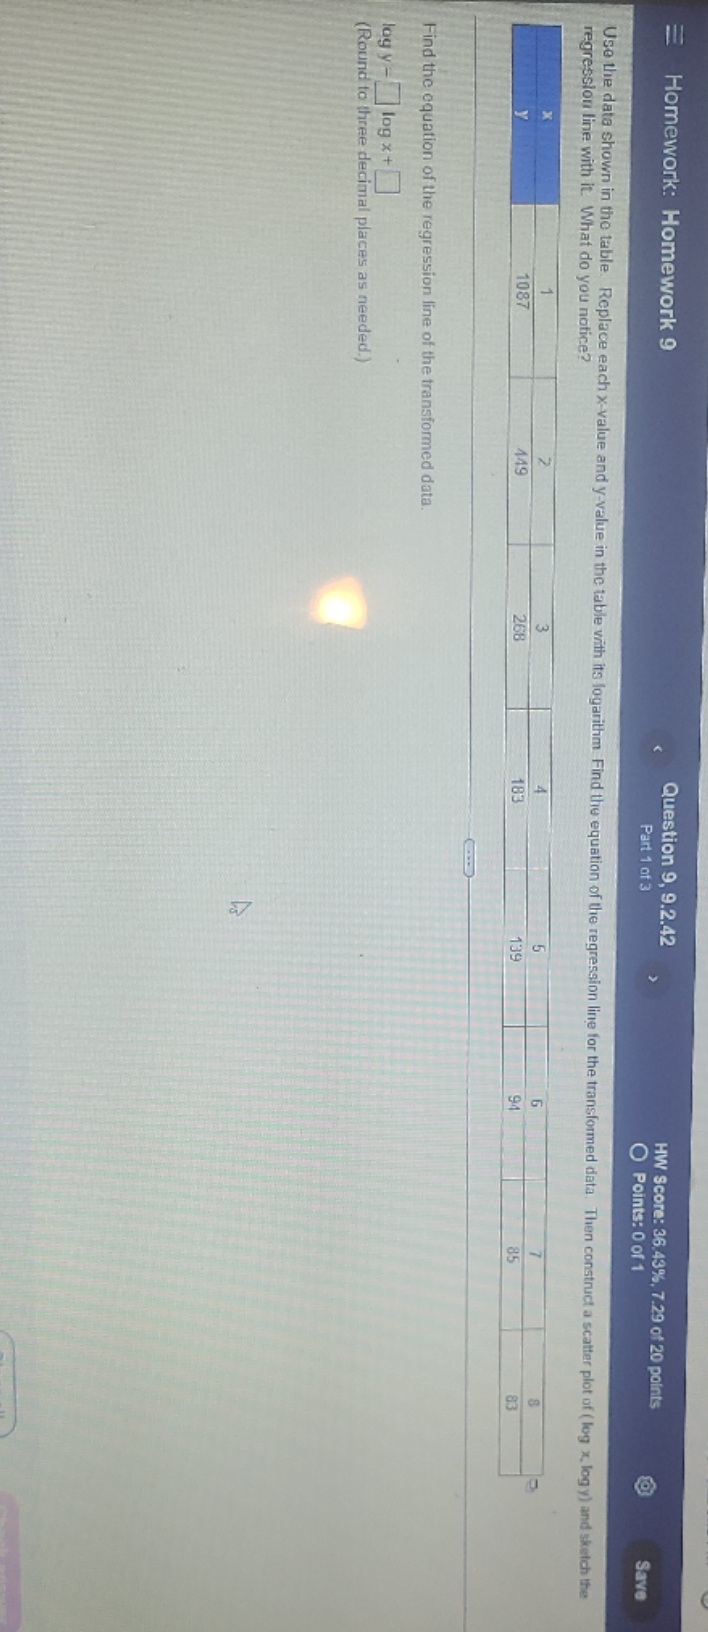
Homework: Homework 9 Question 9, 9.2.42 HW Score: 36.43%, 7.29 of 20 points Part 1 of 3 Points: 0 of 1 Save Use the data shown in the table. Replace each x value and y-value in the table with its logarithm. Find the equation of the regression line for the transformed data. Then construct a scatter plot of ( log x. logy) and sketch the regression line with it. What do you notice? 1087 183 139 Find the equation of the regression line of the transformed data. log y -log x + (Round to three decimal places as needed.)
Step by Step Solution
There are 3 Steps involved in it
1 Expert Approved Answer
Step: 1 Unlock

Question Has Been Solved by an Expert!
Get step-by-step solutions from verified subject matter experts
Step: 2 Unlock
Step: 3 Unlock