

Question: Math 3 Music (Raw Data, software Required): There is a lot of interest in the relationship between studying music and studying math. We will look
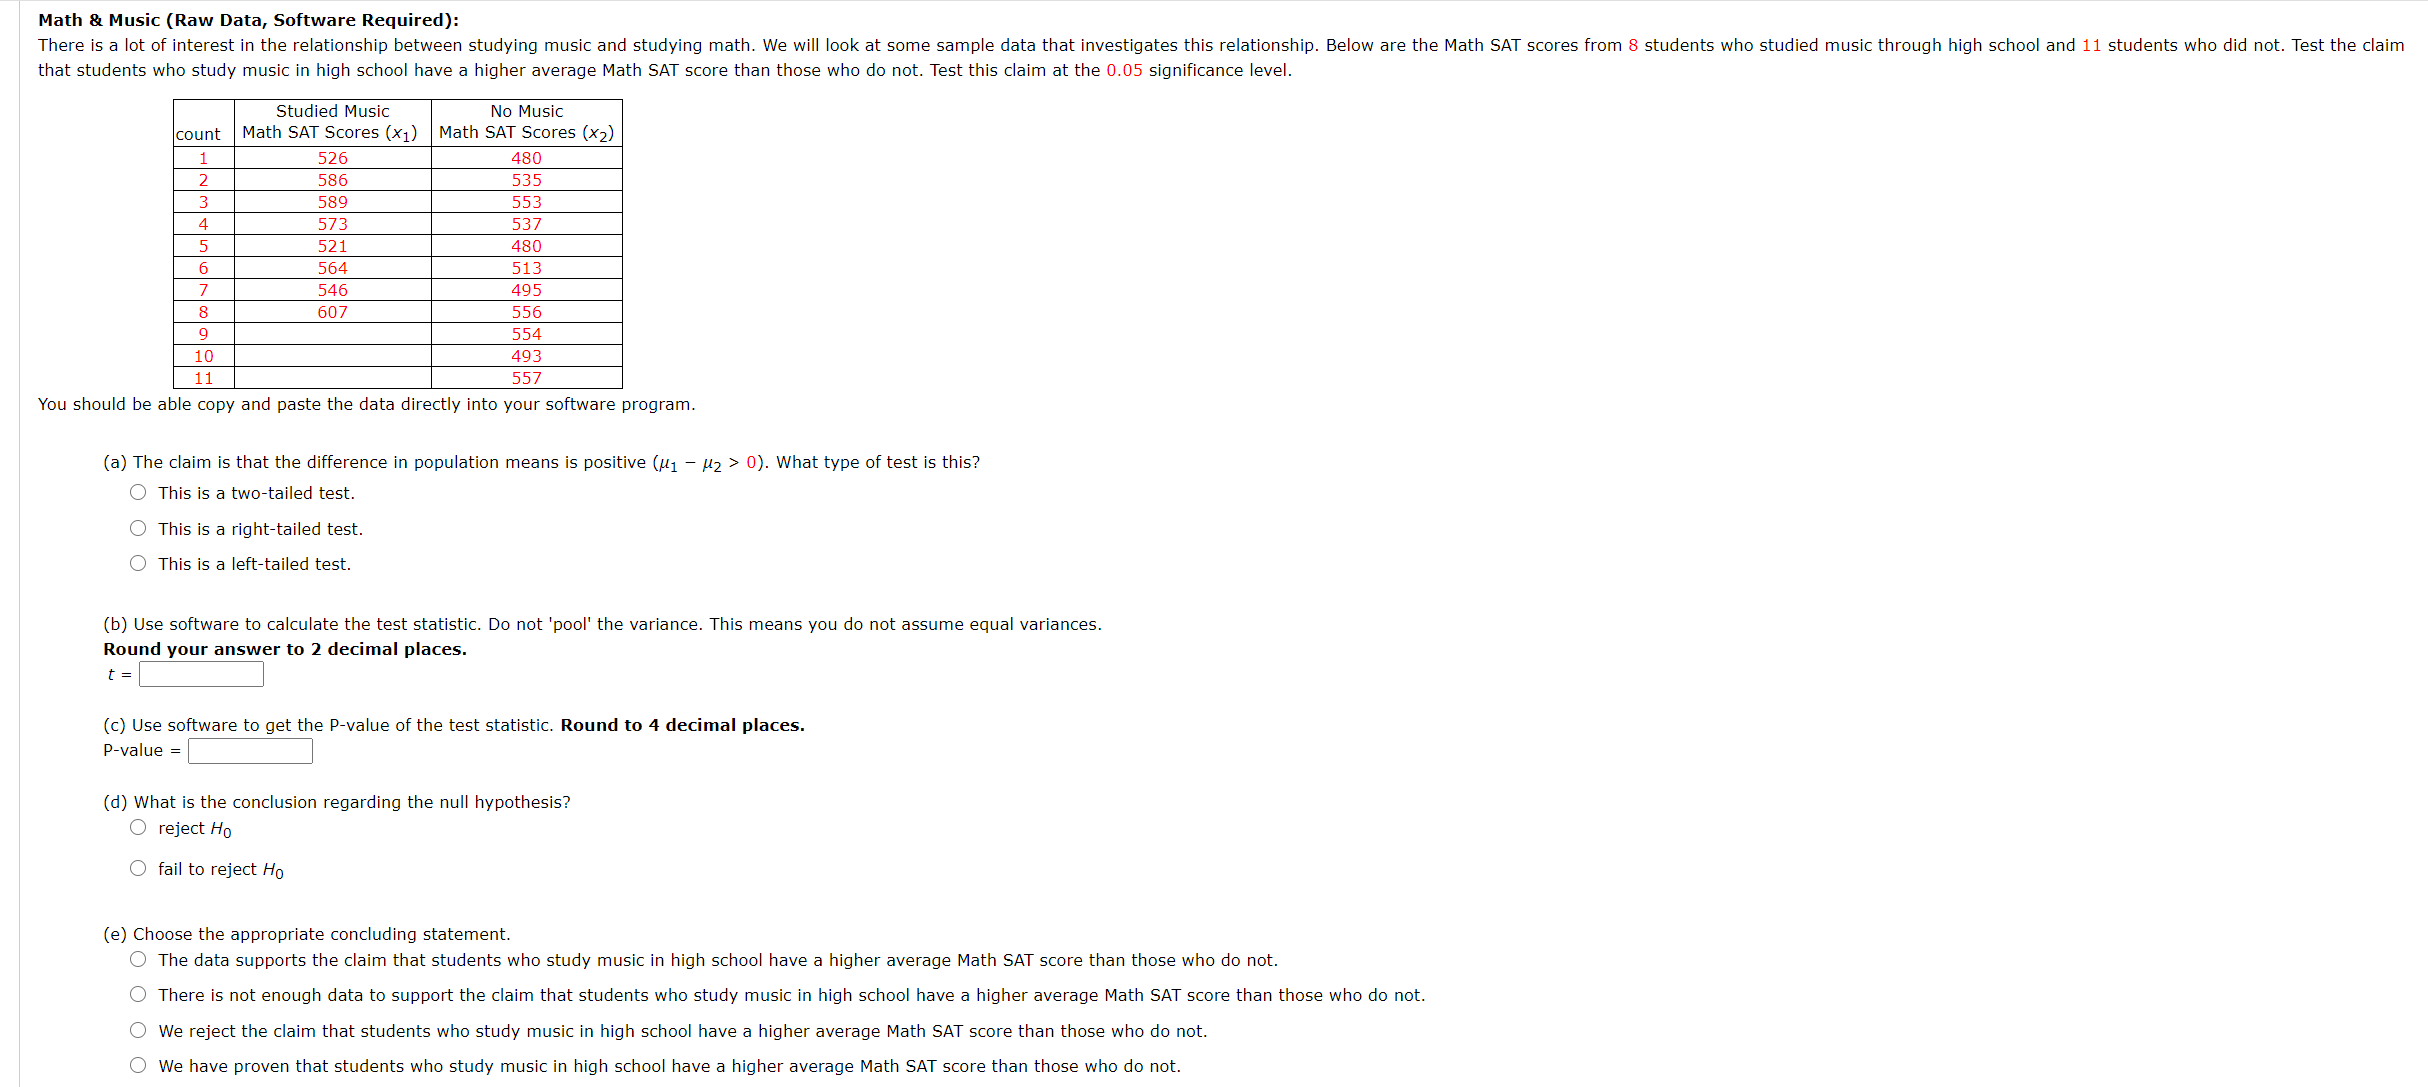
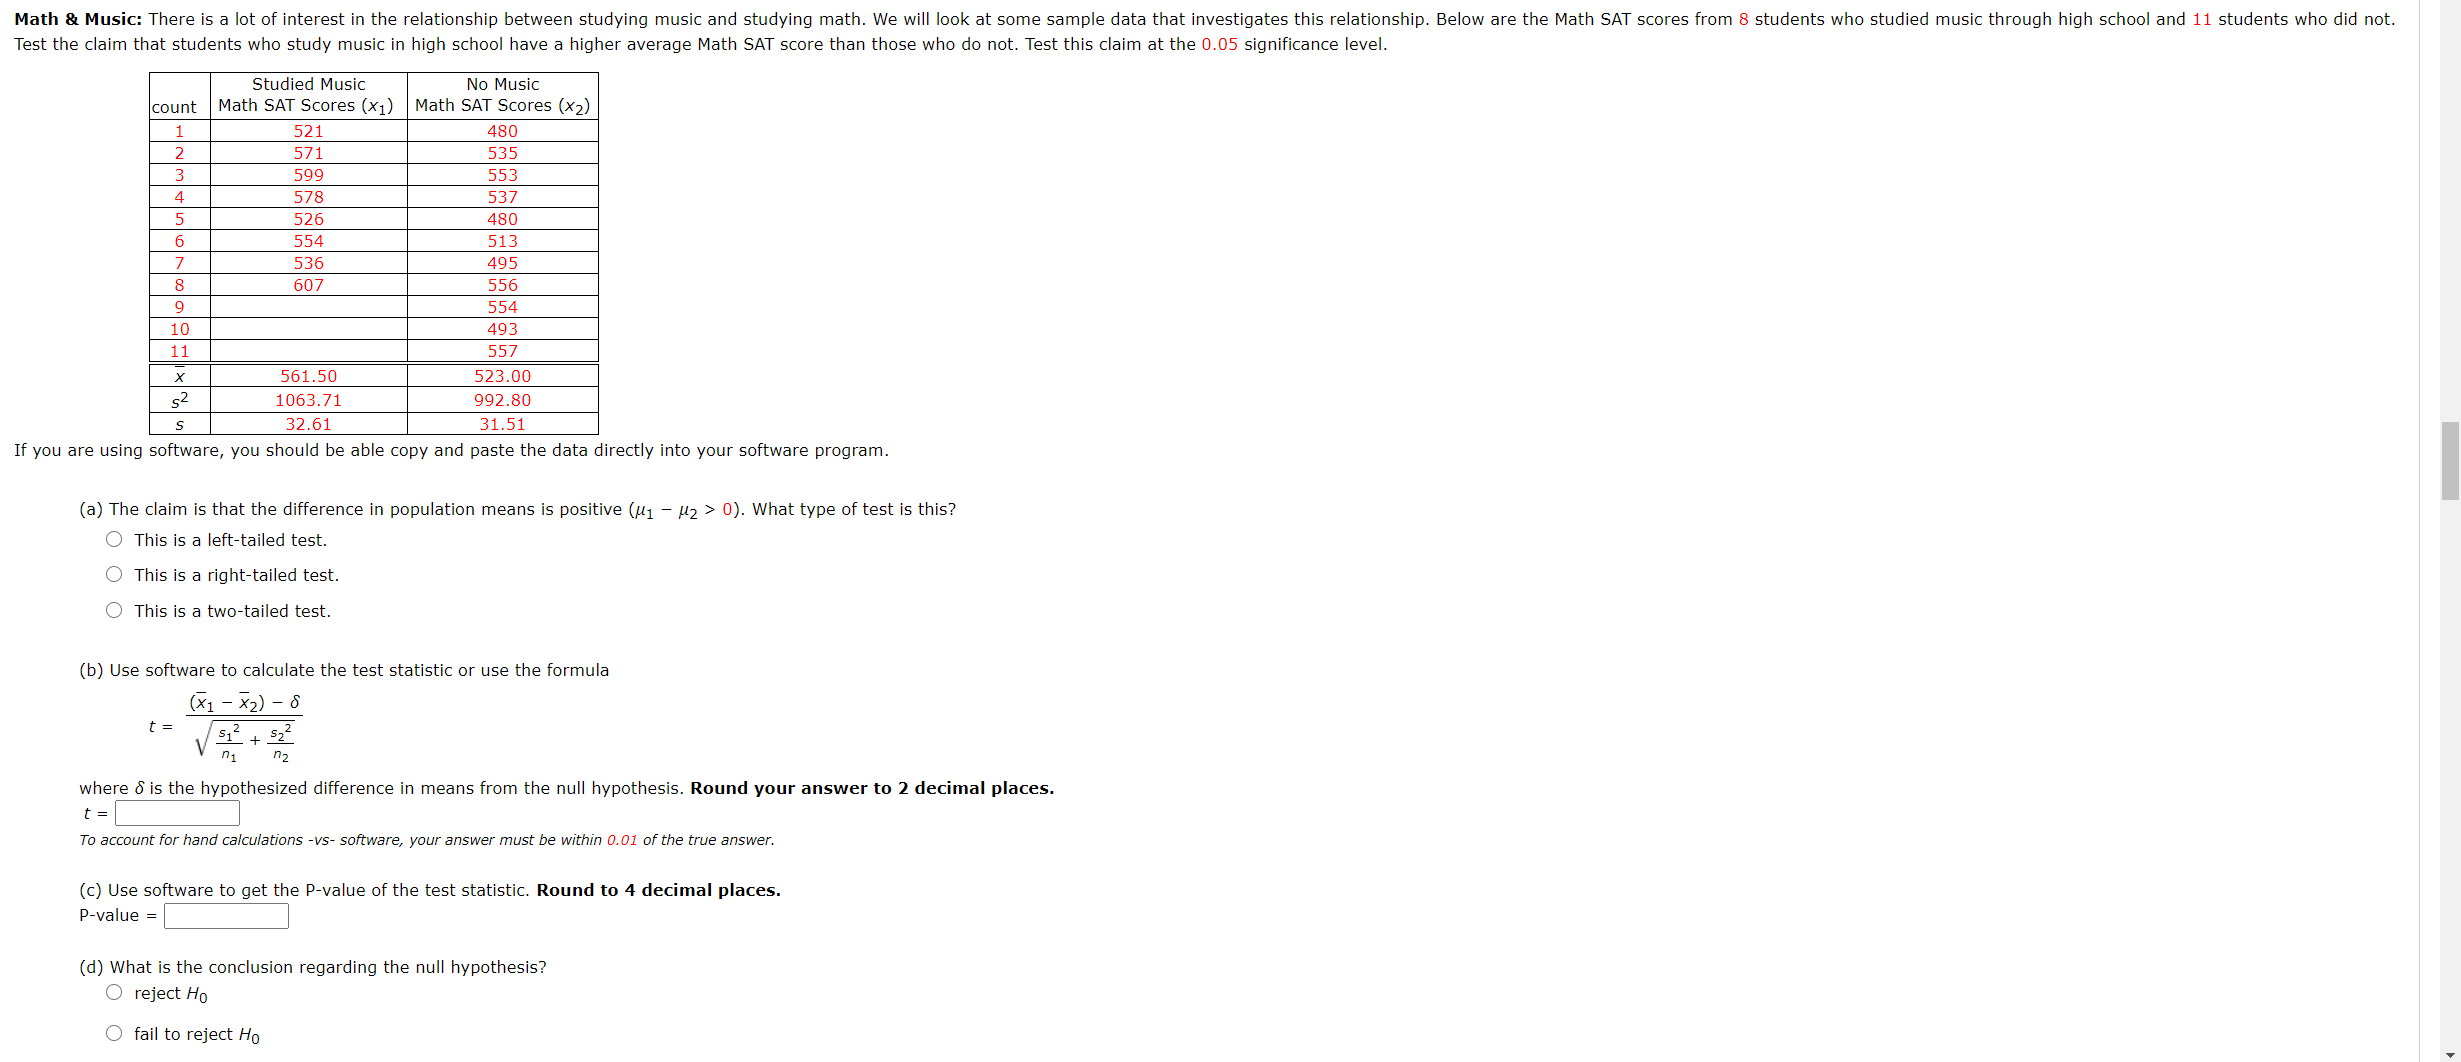
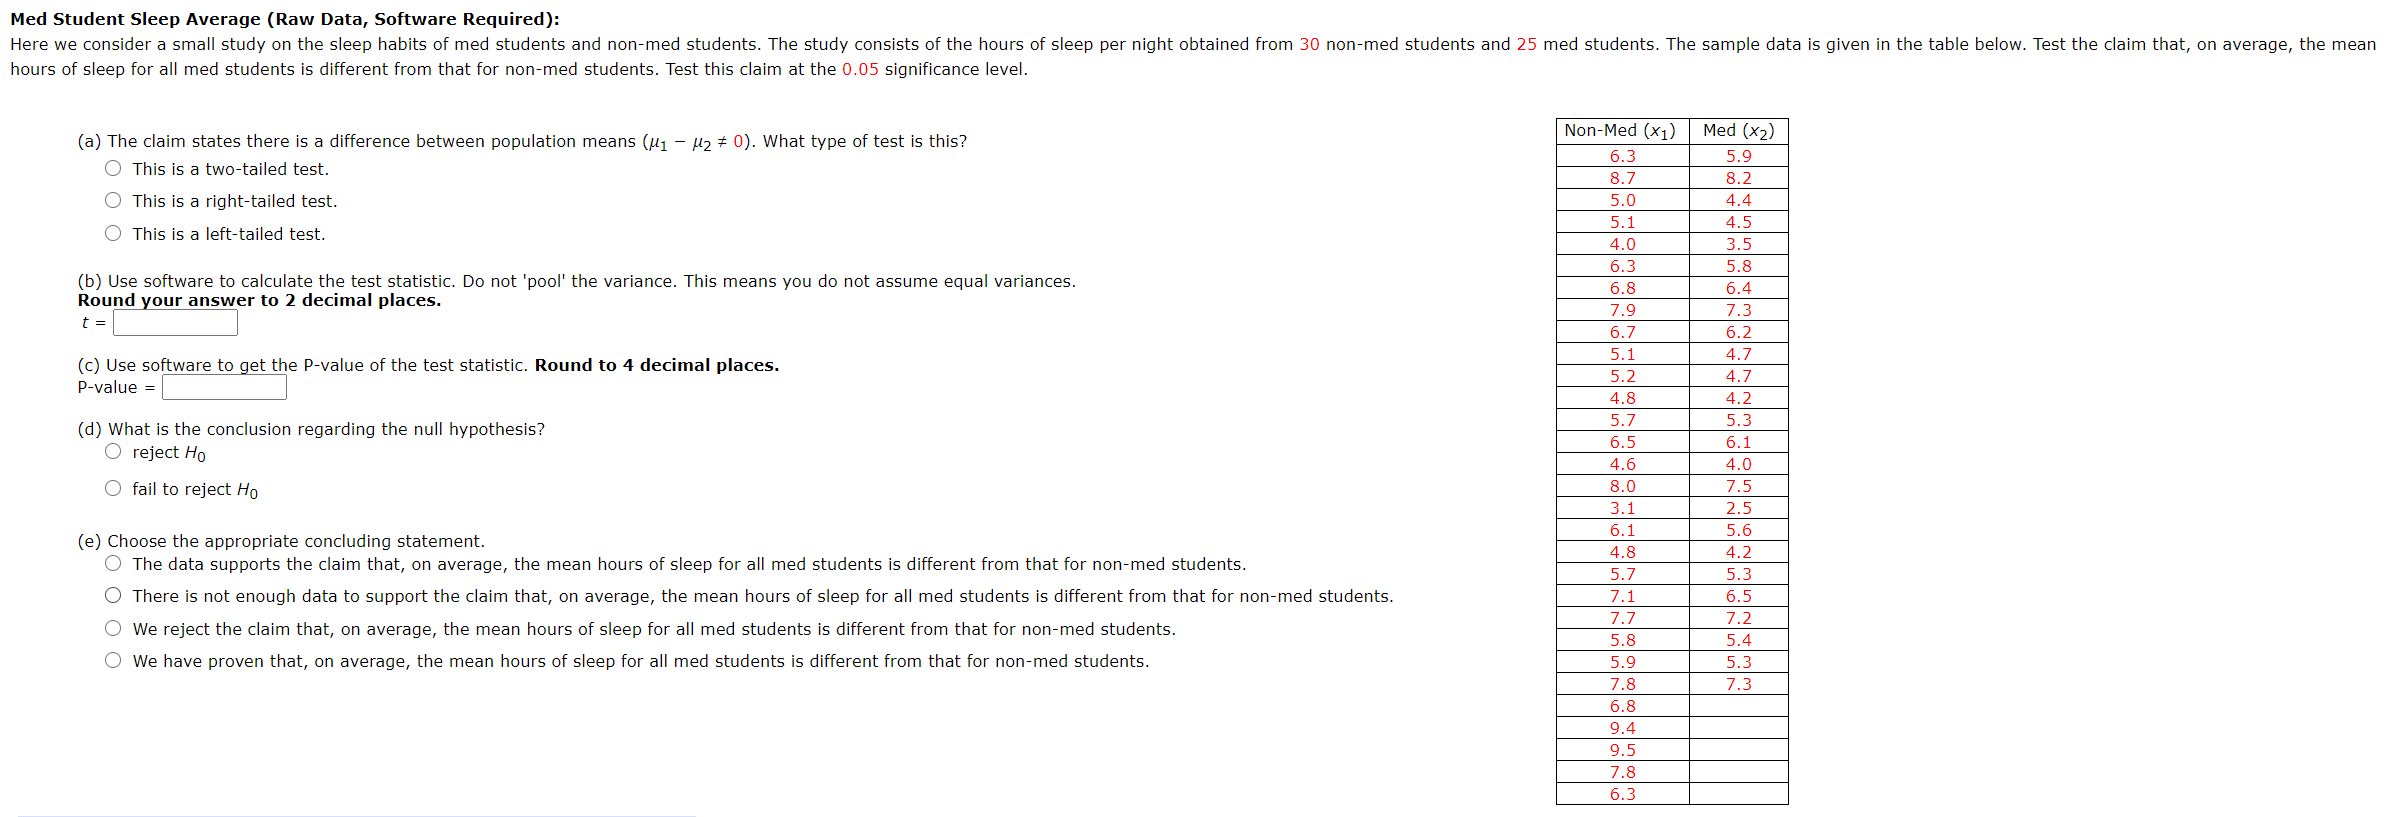
Math 3 Music (Raw Data, software Required): There is a lot of interest in the relationship between studying music and studying math. We will look at some sample data that investigates this relationship. Below are the Math SAT scores from 5 students who studied music through high school and 11 students who did not. Test the claim that students who study music in high school have a higher average Math SAT score than those who do not. Test this claim at the 0.05 significance level. studied Music No Music Count Math SAT Scores (X1) Math SAT Scores (X2) 1 526 480 2 586 535 3 589 553 4 573 537 5 521 480 6 564 513 7 545 495 8 607 556 9 554 10 493 11 557 Vou should be able CODY and paste the data directly into Your software program. (a) The claim ls that the difference in population means is positive ([11 [12 > u). what type of test ls thls? O This is a twoatailed test, O This Is a rlghtrtalled test. 0 This is a left-tailed test. (b) Use software to calculate the test statistic. Do not IlJool' the variance, This means You do not assume equal Variances. Round your answer to 2 decimal places. (c) Use software to get the Pavalue of the test statistic. Round to 4 decimal places. Pavalue : (d) what is the conclusion regardan the null hypothesis? 0 reject Ho O fail to reject l-lo (e) Choose the appropriate Concluding statement 0 The data supports the claim that students who study music in high school have a higher average Math SAT score than those who do not, 0 There is not enough data to support the claim that students who study music in high school have a higher average Math SAT score than those who do not. 0 We reject the claim that studene who study music in high school have a higher average Math SAT score than those who do not. 0 We have prove" that students who study music in high school have a higher average Math SAT score than those who do not. Math & Music: There is a lot or interest in the relationship between studying music and studying math. We will look at some sample data that investigates this relationship. Below are the Math SAT scores from 5 students who studied music through high school and 11 students who did not. Test the claim that studens who study music In hlgh school have a higher average Math SAT score than those who do not. Test this claim at the 0.05 slgnlcance level. studied Music No Music count Math SAT Scores (x1) Math SAT Scores 0(2) 1 521 480 z 571 535 3 599 553 4 573 537 5 526 400 6 554 513 7 536 495 s 607 556 9 55A 10 493 11 557 x 551.50 523.00 s2 1063.71 992.30 s 32 61 31.51 If you are using software, you should be able copy and paste the data directly into your software program. (a) The claim is that the difference in population means is positive (it, 7 M2 > 0). what type of test is this? 0 This is a lert~talled test. 0 THIS IS a rlghtrtalled test. 0 This is a (wealalled test. (b) U56 software to calculate the test Statistic or use the formula 1;) 722) , 5 "I "2 where is is the hypothesized difference In means from the null hypothesis. Round your answer to 2 decimal places. t To account for hand calculations -vs- software, you: answer must be WIUHII a. 01 of the true answer. (c) Use soware to get the P-value of the test statistic. Round to 4 decimal places. Pavalue : (d) what is the conclusion regarding the null hypothesis? 0 reject Ho O fail to reject Ho Med Student Sleep Average (Raw Data, Software Required): Here we consider a small study on the sleep habits of med students and non-med students. The study consists of the hours of sleep per night obtained from 30 non-med students and 25 med students. The sample data is given in the table below. Test the claim that, on average, the mean hours of sleep for all med students is different from that for non-med students. Test this claim at the 0.05 significance level. (a) The claim states there is a difference between population means (/1 - /2 # 0). What type of test is this? Non-Med (X1) Med (x2) O This is a two-tailed test. 6.3 5.C 8.7 8.2 O This is a right-tailed test. 5.0 4.4 O This is a left-tailed test. 5.1 4.5 4.0 3.5 (b) Use software to calculate the test statistic. Do not 'pool' the variance. This means you do not assume equal variances. 6.3 5.8 Round your answer to 2 decimal places. 6.8 6.4 7.9 7.3 6.7 6.2 (c) Use software to get the P-value of the test statistic. Round to 4 decimal places. 5 .1 4.7 P-value = 5.2 4.7 4.8 (d) What is the conclusion regarding the null hypothesis? 5.7 4.2 5 .3 O reject Ho 6.5 6.1 4.6 4.0 O fail to reject Ho 8.0 3.1 7.5 2.5 (e) Choose the appropriate concluding statement. 6.1 5.6 The data supports the claim that, on average, the mean hours of sleep for all med students is different from that for non-med students. 4.8 4.2 5.7 5.3 There is not enough data to support the claim that, on average, the mean hours of sleep for all med students is different from that for non-med students. 7.1 6.5 We reject the claim that, on average, the mean hours of sleep for all med students is different from that for non-med students. 7.7 5.8 7.2 5.4 O We have proven that, on average, the mean hours of sleep for all med students is different from that for non-med students. 5.9 7.8 5.3 7.3 6.8 9.4 9.5 7.8 6.3
Step by Step Solution
There are 3 Steps involved in it

Get step-by-step solutions from verified subject matter experts