

Question: Math | Graded Assignment | Unit 3 Test, Part 1 | Connections Between Data 2: (15 points) A linear model for the data in the
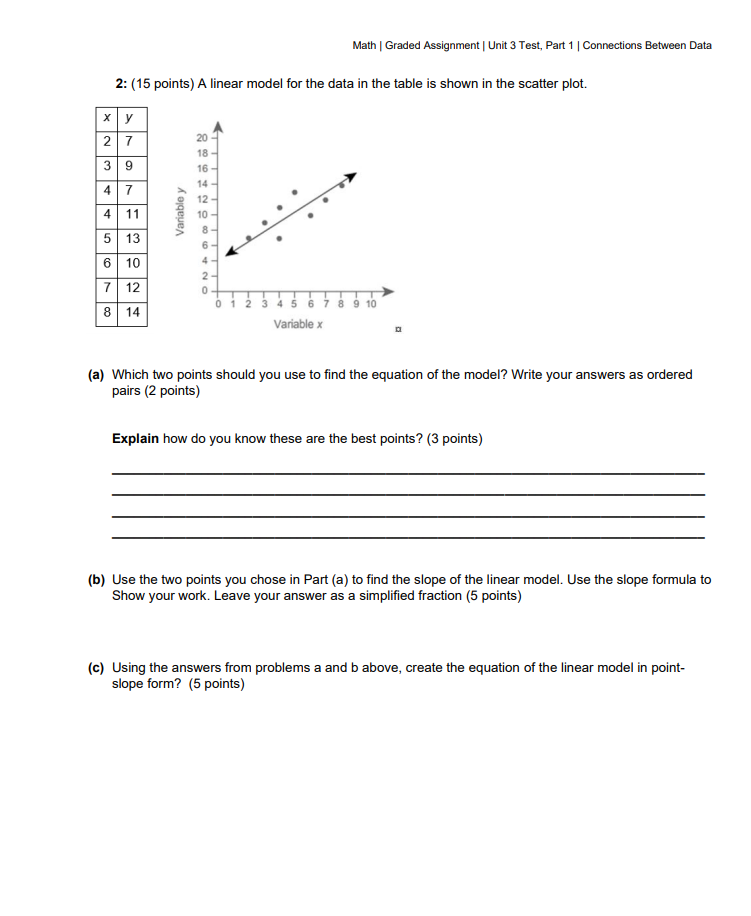
Math | Graded Assignment | Unit 3 Test, Part 1 | Connections Between Data 2: (15 points) A linear model for the data in the table is shown in the scatter plot. X y 2 7 20 18 - 3 9 16 - 4 7 4 11 8 - 13 Variable y 6 - 6 10 12 8 14 0 1 2 3 4 5 6 7 8 9 10 Variable x (a) Which two points should you use to find the equation of the model? Write your answers as ordered pairs (2 points) Explain how do you know these are the best points? (3 points) (b) Use the two points you chose in Part (a) to find the slope of the linear model. Use the slope formula to Show your work. Leave your answer as a simplified fraction (5 points) (c) Using the answers from problems a and b above, create the equation of the linear model in point- slope form? (5 points)
Step by Step Solution
There are 3 Steps involved in it

Get step-by-step solutions from verified subject matter experts