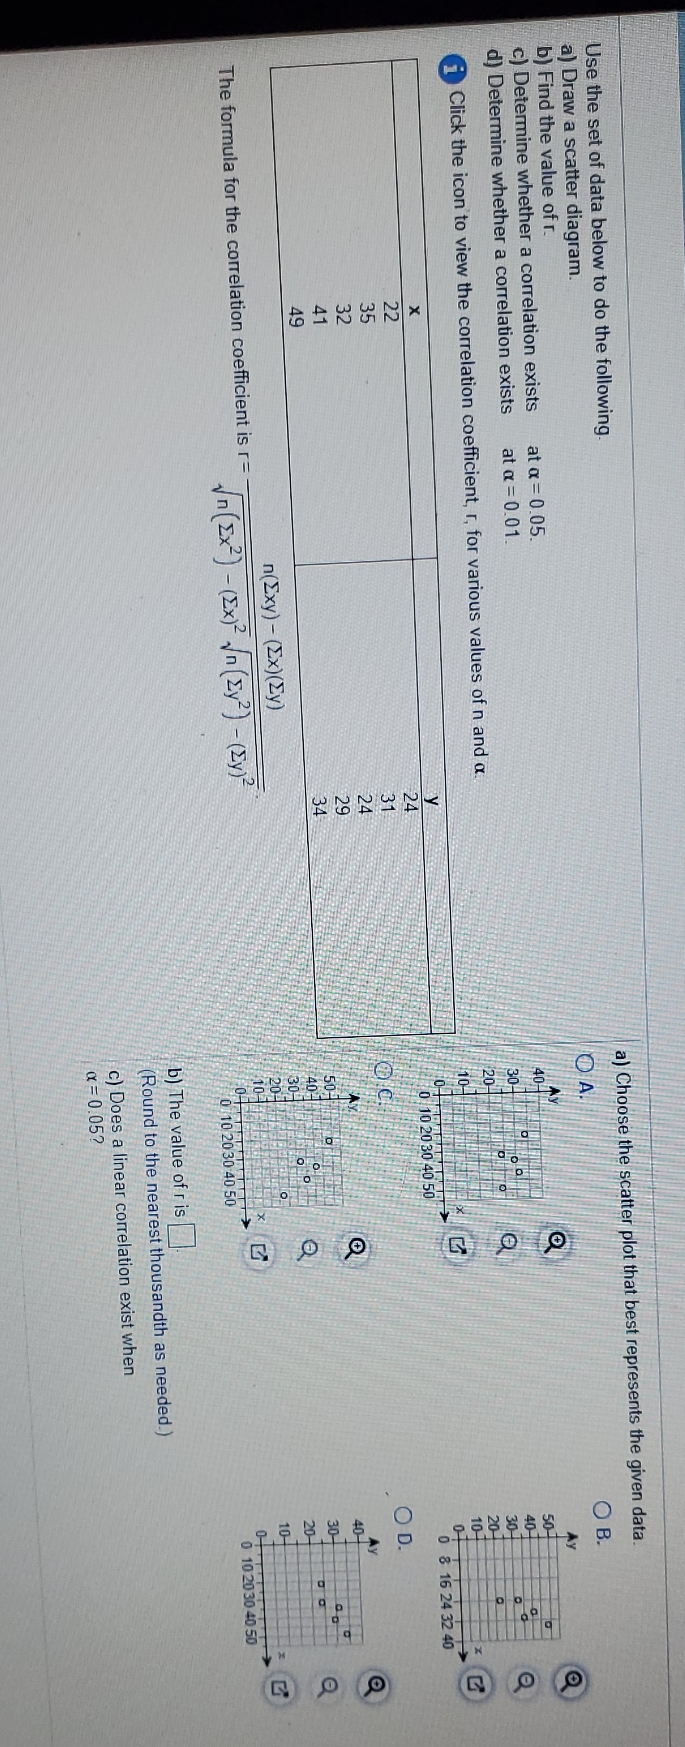
Question: math problem. Use the set of data below to do the following. a) Draw a scatter diagram. a) Choose the scatter plot that best represents

math problem.

math problem. Use the set of data below to do the
Use the set of data below to do the following. a) Draw a scatter diagram. a) Choose the scatter plot that best represents the given data. b) Find the value of r. OA. O B. c) Determine whether a correlation exists at a = 0.05. d) Determine whether a correlation exists at a = 0.01. 50- i Click the icon to view the correlation coefficient, r, for various values of n and o. 40- 30- O 20- 10 10 20 30 40 50 0 8 16 24 32 40 35 32 OD. 41 50 40- 40- 30- n(Exy) - (Ex) ( Zy) 30 20- The formula for the correlation coefficient is = 204 In (Ex? ) -(Ex)2 Nn ( zy? ) -( xy)2 10 10 07 10 20 30 40 50 0 10 20 30 40 50 b) The value of r is Round to the nearest thousandth as needed.) c) Does a linear correlation exist when ox = 0.05

Step by Step Solution

There are 3 Steps involved in it

1 Expert Approved Answer
Step: 1 Unlock blur-text-image
Question Has Been Solved by an Expert!

Get step-by-step solutions from verified subject matter experts

Step: 2 Unlock
Step: 3 Unlock

Students Have Also Explored These Related Mathematics Questions!