

Question: Math The data in the table represent the amount of raw material (in tons) put into an injection molding machine each day (), and the
Math

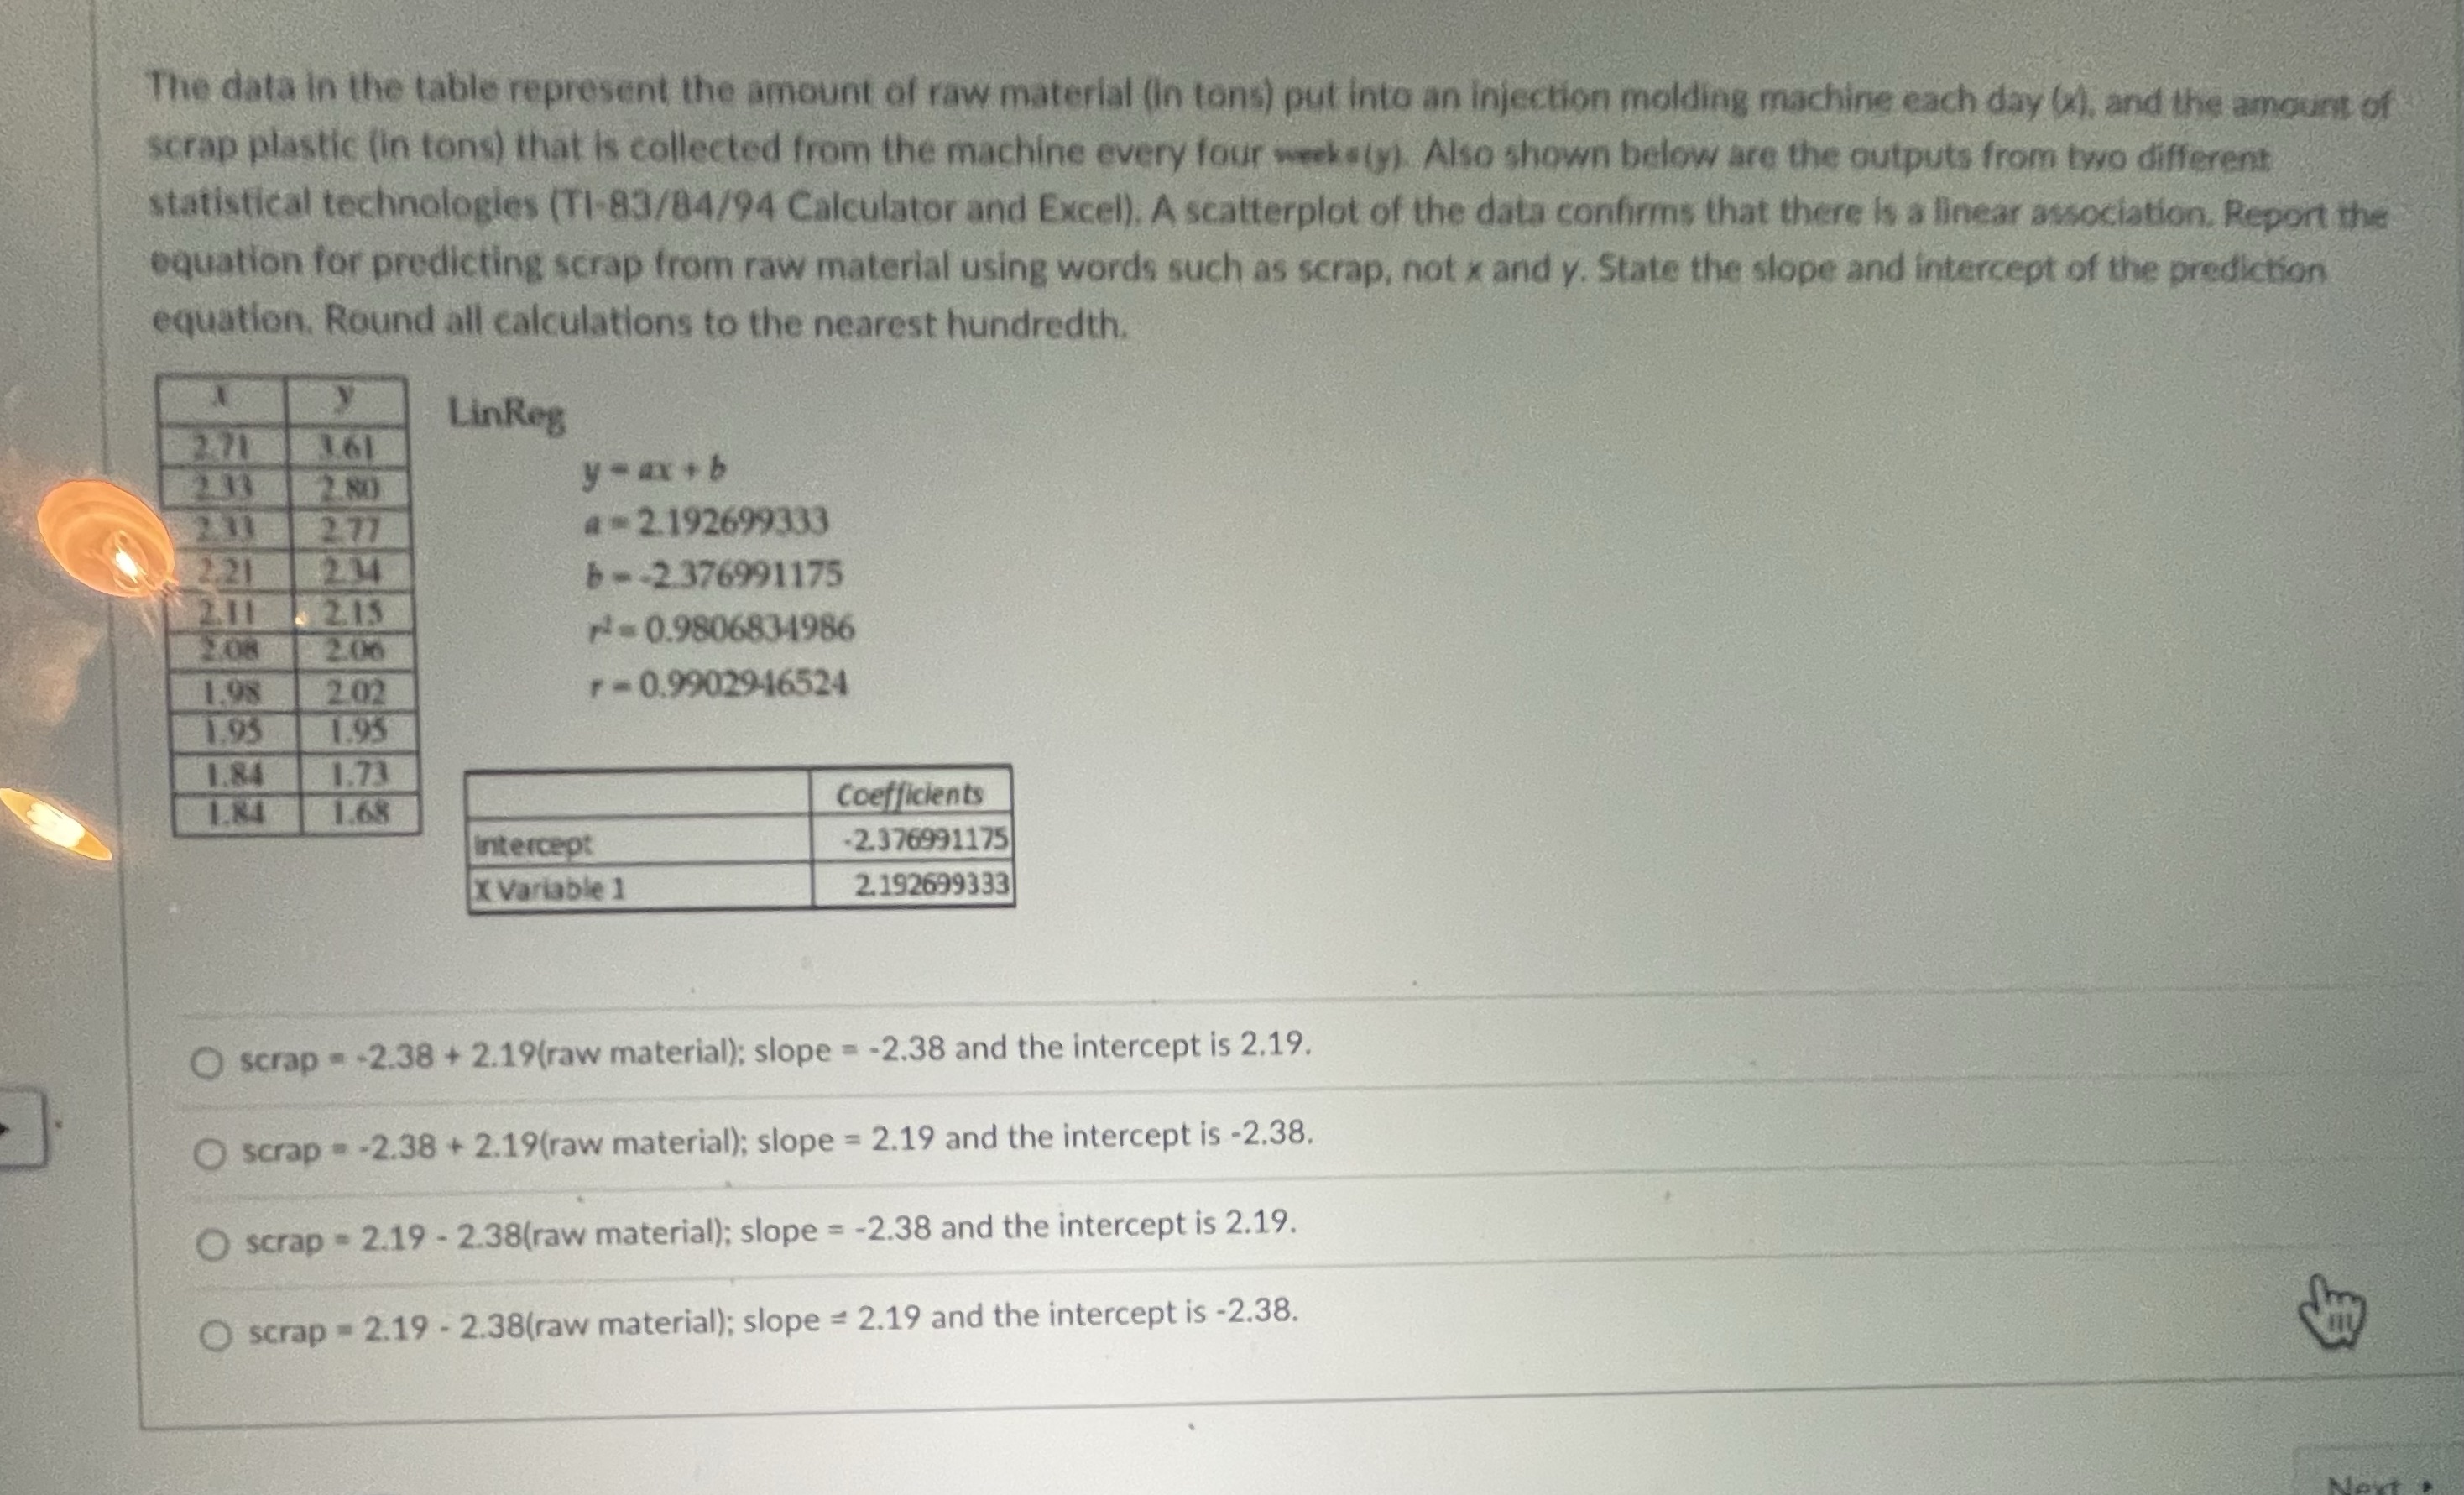
The data in the table represent the amount of raw material (in tons) put into an injection molding machine each day (), and the amount of scrap plastic (in tons) that is collected from the machine every four weeks(y). Also shown below are the outputs from two different statistical technologies (TI-83/84/94 Calculator and Excel), A scatterplot of the data confirms that there is a linear association, Report the equation for predicting scrap from raw material using words such as scrap, not x and y. State the slope and intercept of the prediction equation. Round all calculations to the nearest hundredth. LinReg 2.71 3.61 233 2.80 y - ax + b 2.77 a =2.192699333 2.21 2.34 b--2.376991175 2.11 2.15 2.06 = 0.9806834986 1.98 2 02 r - 0.99029-46524 1.95 1.95 1.84 1.73 1.68 Coefficients intercept -2.376991175 X Variable 1 2.192699333 O scrap = -2.38 + 2.19(raw material); slope = -2.38 and the intercept is 2.19. scrap - -2.38 + 2.19(raw material); slope = 2.19 and the intercept is -2.38. O scrap - 2.19 - 2.38(raw material); slope = -2.38 and the intercept is 2.19. O scrap = 2.19 - 2.38(raw material); slope = 2.19 and the intercept is -2.38
Step by Step Solution
There are 3 Steps involved in it

Get step-by-step solutions from verified subject matter experts