

Question: Mathematica with advanced math Part 3 PolarPlot with travelling point that changes color -- Compete the function pointOnPolar You will need to read the Help
Mathematica with advanced math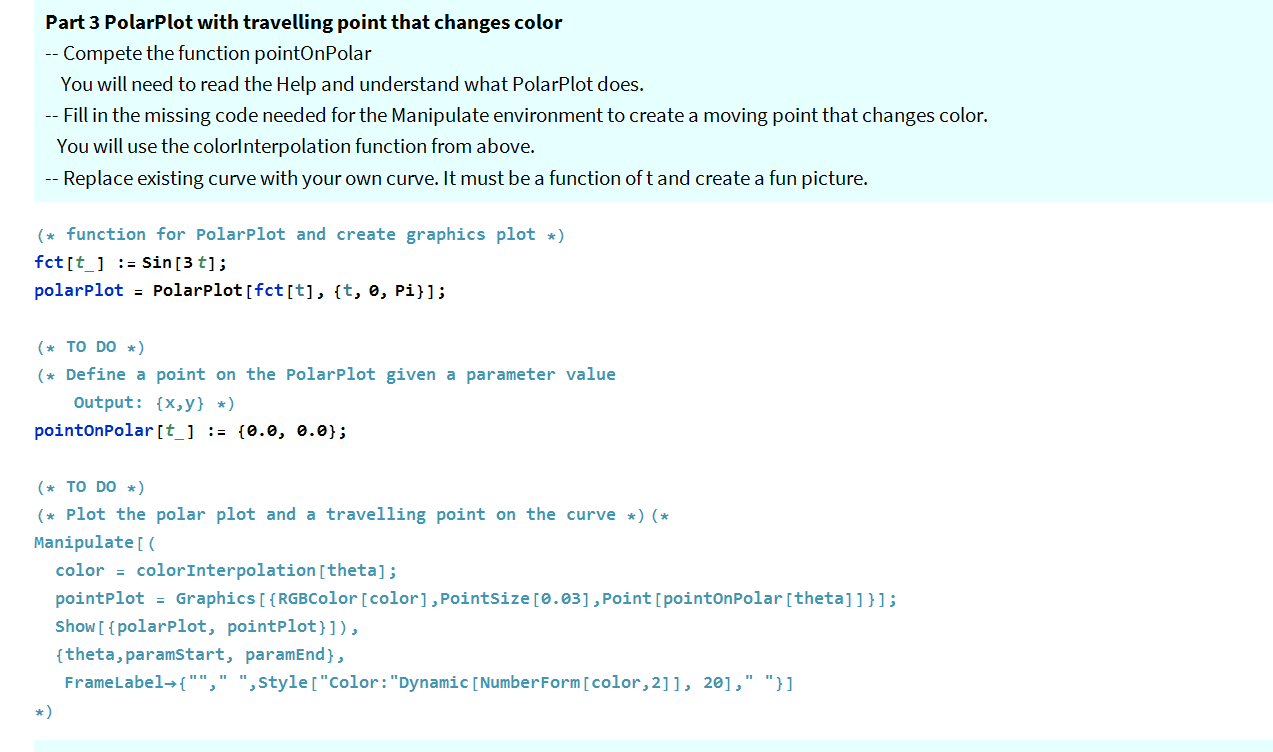
Part 3 PolarPlot with travelling point that changes color -- Compete the function pointOnPolar You will need to read the Help and understand what PolarPlot does. -- Fill in the missing code needed for the Manipulate environment to create a moving point that changes color. You will use the colorInterpolation function from above. -- Replace existing curve with your own curve. It must be a function oft and create a fun picture. (* function for Polarplot and create graphics plot *) fct[t_] := Sin[3 t]; polarplot = Polarplot [fct[t], {t, 0, Pi}]; (* TO DO *) (* Define a point on the Polarplot given a parameter value Output: {x,y} *) pointonPolar[t_] := {0.0, 0.0}; (* TO DO *) (* plot the polar plot and a travelling point on the curve *) (* Manipulate[ color = colorInterpolation [theta]; pointplot = Graphics [ {RGB Color[color], PointSize [0.03], Point[pointonPolar[theta]]}]; Show[ {polarplot, pointplot}]), {theta, paramStart, paramEnd), FrameLabel+{"", " ", Style["Color: "Dynamic [Number Form[color, 2]], 20]," "}] Part 3 PolarPlot with travelling point that changes color -- Compete the function pointOnPolar You will need to read the Help and understand what PolarPlot does. -- Fill in the missing code needed for the Manipulate environment to create a moving point that changes color. You will use the colorInterpolation function from above. -- Replace existing curve with your own curve. It must be a function oft and create a fun picture. (* function for Polarplot and create graphics plot *) fct[t_] := Sin[3 t]; polarplot = Polarplot [fct[t], {t, 0, Pi}]; (* TO DO *) (* Define a point on the Polarplot given a parameter value Output: {x,y} *) pointonPolar[t_] := {0.0, 0.0}; (* TO DO *) (* plot the polar plot and a travelling point on the curve *) (* Manipulate[ color = colorInterpolation [theta]; pointplot = Graphics [ {RGB Color[color], PointSize [0.03], Point[pointonPolar[theta]]}]; Show[ {polarplot, pointplot}]), {theta, paramStart, paramEnd), FrameLabel+{"", " ", Style["Color: "Dynamic [Number Form[color, 2]], 20]," "}]
Step by Step Solution
There are 3 Steps involved in it

Get step-by-step solutions from verified subject matter experts