

Question: Mathematical Solution Q3: Decision Variables (Define T and C as decision variables below The unknown quantities that are expected to be estimated as an output
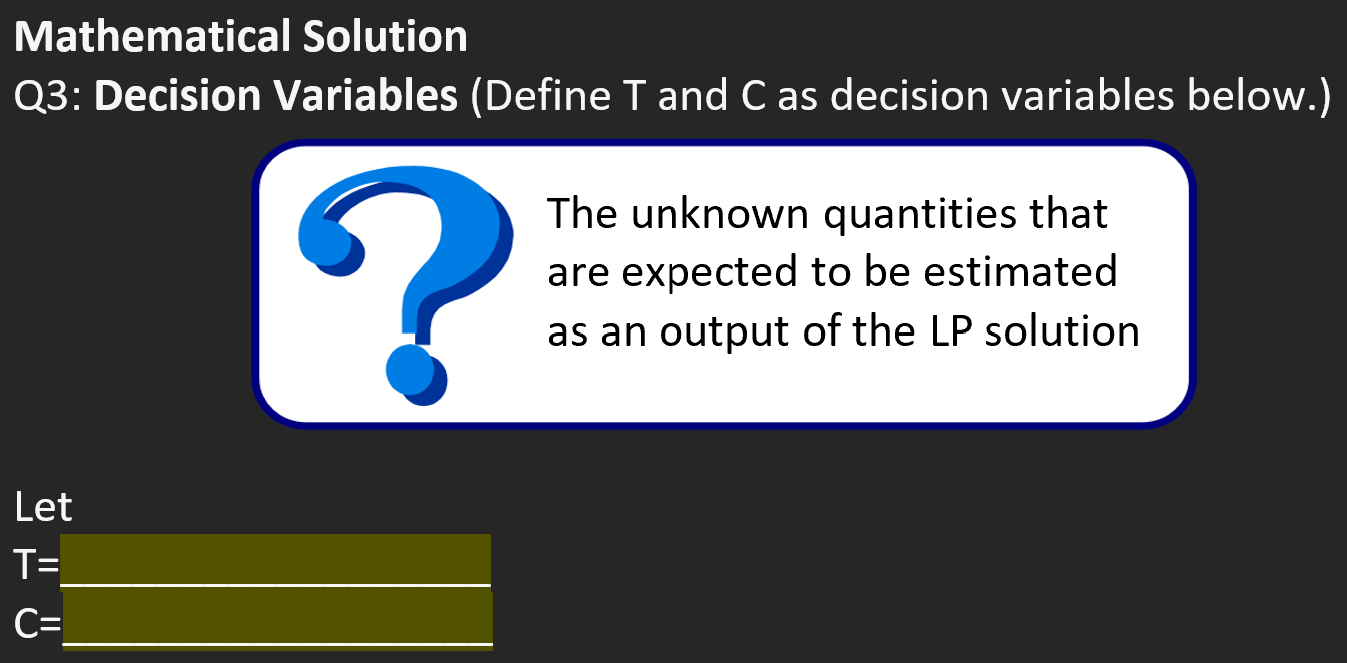
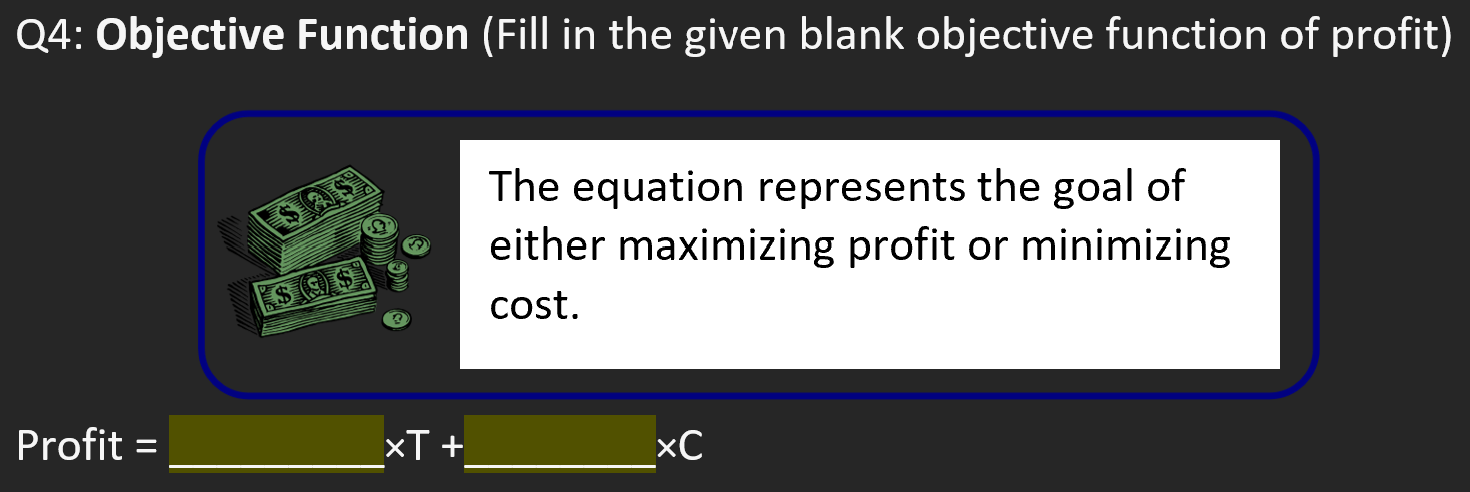
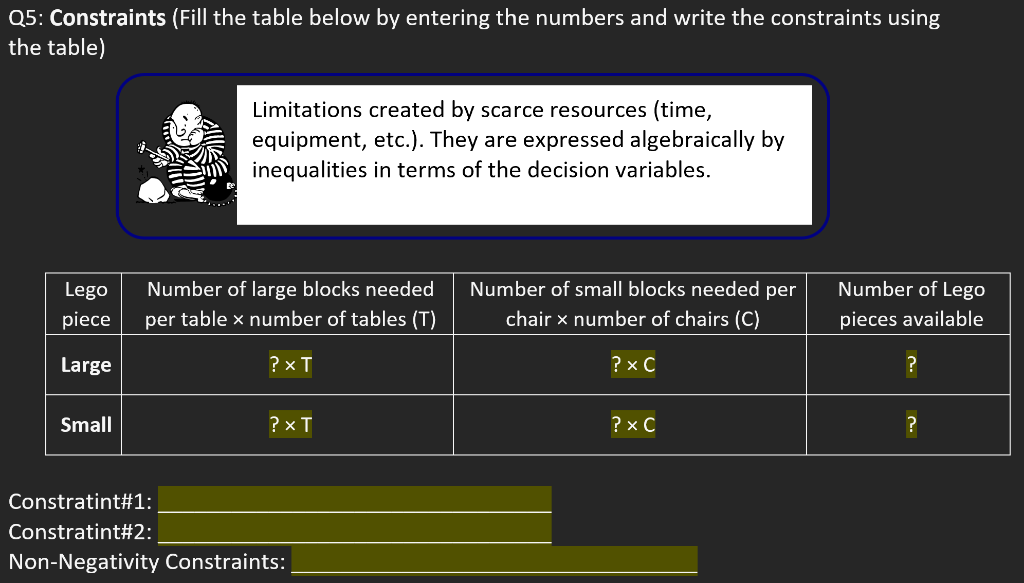
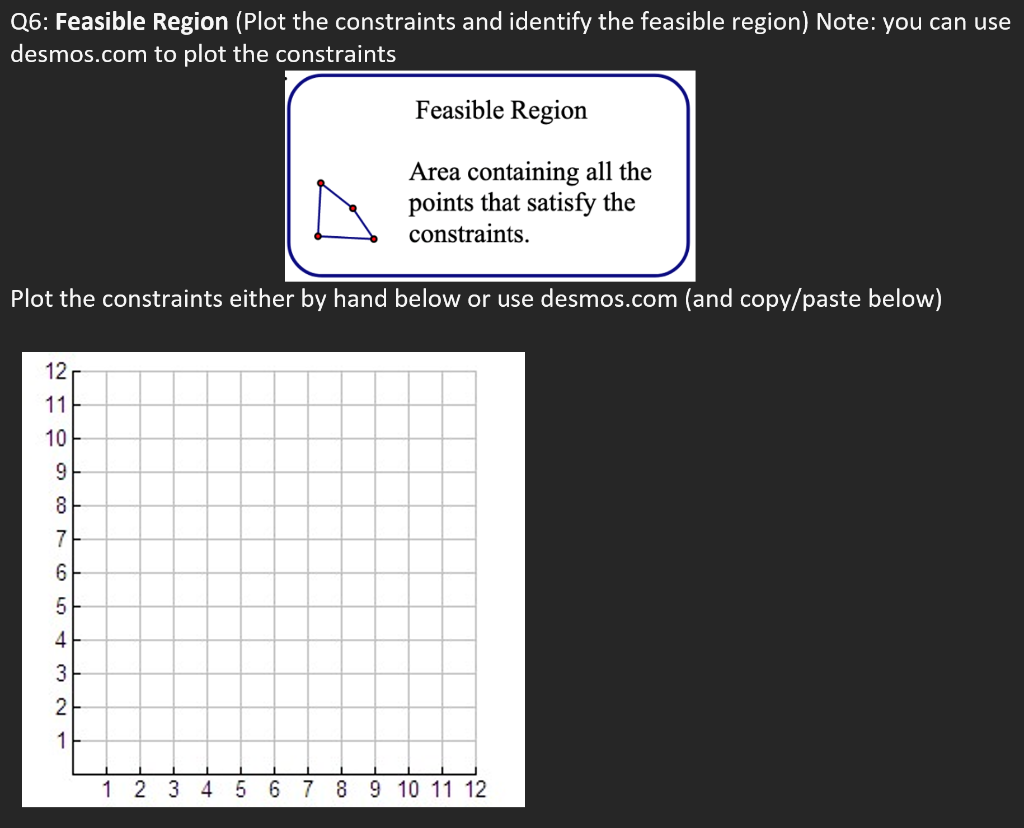
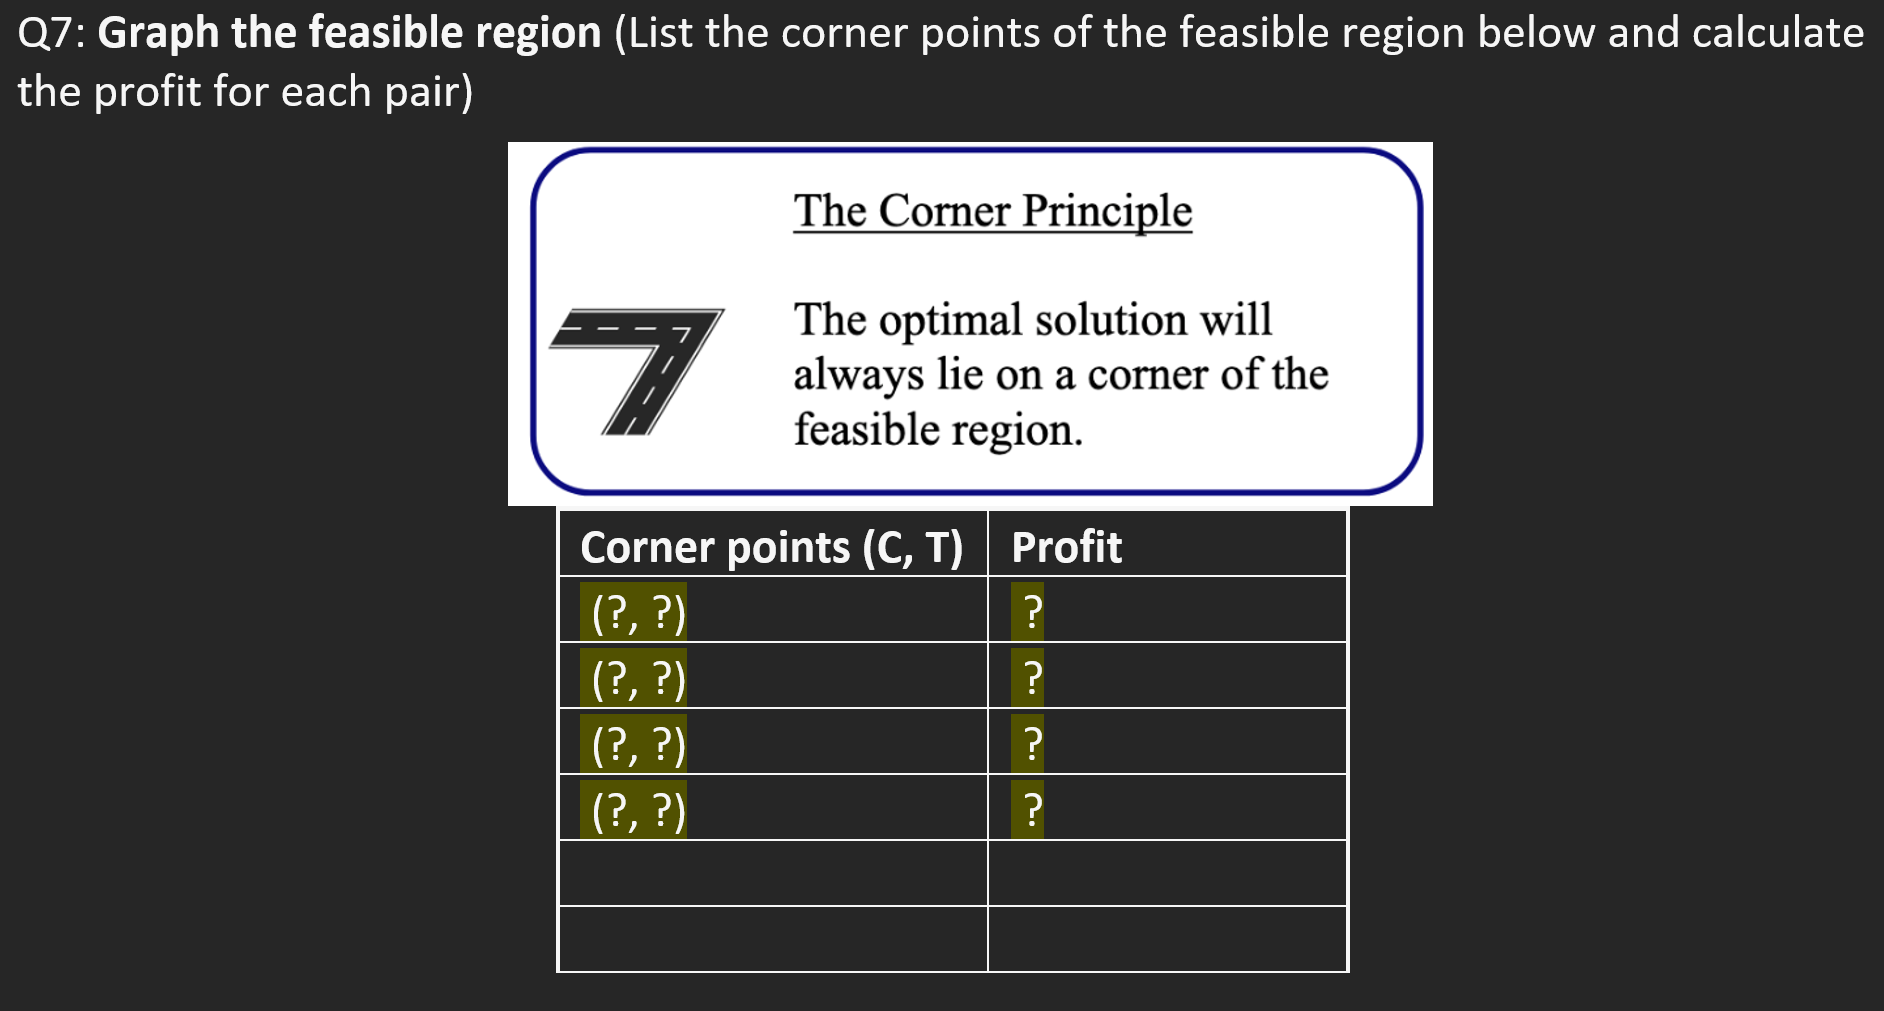
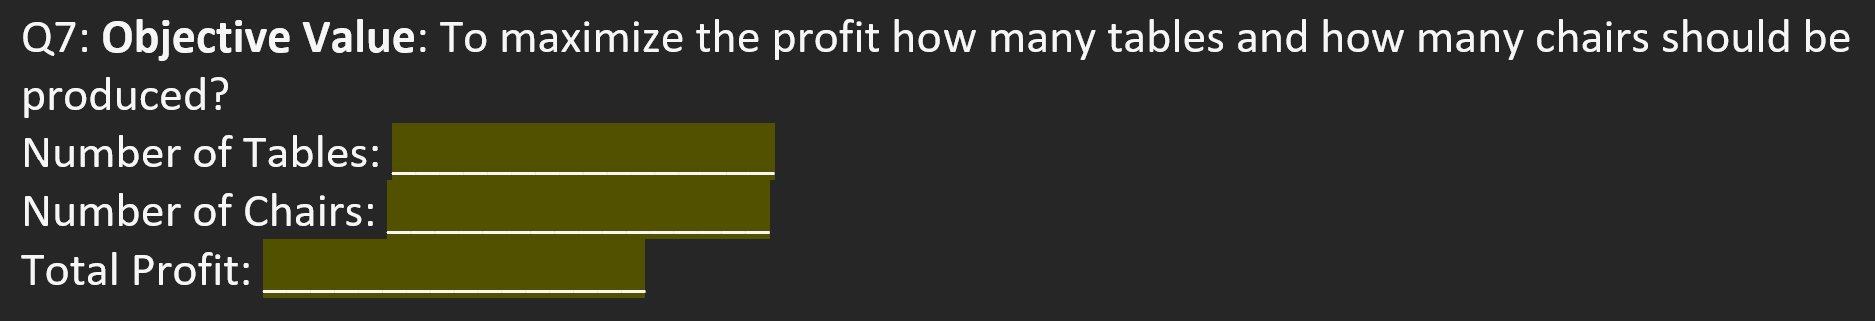
Mathematical Solution Q3: Decision Variables (Define T and C as decision variables below The unknown quantities that are expected to be estimated as an output of the LP solution Q4: Objective Function (Fill in the given blank objective function of The equation represents the goal of either maximizing profit or minimizing cost. 5: Constraints (Fill the table below by entering the numbers and write the constraints using ne table) Limitations created by scarce resources (time, equipment, etc.). They are expressed algebraically by inequalities in terms of the decision variables. Q6: Feasible Region (Plot the constraints and identify the feasible region) Note: you can use desmos.com to plot the constraints Feasible Region Area containing all the points that satisfy the constraints. Plot the constraints either by hand below or use desmos.com (and copy/paste below) Q7: Graph the feasible region (List the corner points of the feasible region below and calculate the profit for each pair) The Corner Principle The optimal solution will always lie on a corner of the feasible region. Q7: Objective Value: To maximize the profit how many tables and how many chairs should be produced? Number of Tables: Number of Chairs: Total Profit: Mathematical Solution Q3: Decision Variables (Define T and C as decision variables below The unknown quantities that are expected to be estimated as an output of the LP solution Q4: Objective Function (Fill in the given blank objective function of The equation represents the goal of either maximizing profit or minimizing cost. 5: Constraints (Fill the table below by entering the numbers and write the constraints using ne table) Limitations created by scarce resources (time, equipment, etc.). They are expressed algebraically by inequalities in terms of the decision variables. Q6: Feasible Region (Plot the constraints and identify the feasible region) Note: you can use desmos.com to plot the constraints Feasible Region Area containing all the points that satisfy the constraints. Plot the constraints either by hand below or use desmos.com (and copy/paste below) Q7: Graph the feasible region (List the corner points of the feasible region below and calculate the profit for each pair) The Corner Principle The optimal solution will always lie on a corner of the feasible region. Q7: Objective Value: To maximize the profit how many tables and how many chairs should be produced? Number of Tables: Number of Chairs: Total Profit
Step by Step Solution
There are 3 Steps involved in it

Get step-by-step solutions from verified subject matter experts