

Question: MATHLAB HELP An earthquake data (GM01) is provided as shown. The y axis is its acceleration with unit g. Use matlab if/while/for function (do not
MATHLAB HELP
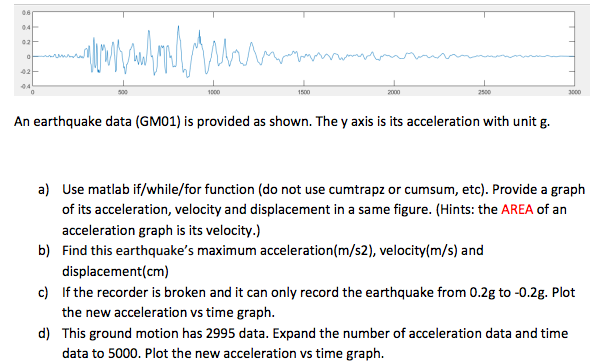
An earthquake data (GM01) is provided as shown. The y axis is its acceleration with unit g. Use matlab if/while/for function (do not use cumtrapz or cumsum, etc). Provide a graph of its acceleration, velocity and displacement in a same figure. Find this earthquake's maximum acceleration(m/s2), velocity(m/s) and displacement(cm) If the recorder is broken and it can only record the earthquake from 0.2g to -0.2g. Plot the new acceleration vs time graph. This ground motion has 2995 data. Expand the number of acceleration data and time data to 5000. Plot the new acceleration vs time graph
Step by Step Solution
There are 3 Steps involved in it
1 Expert Approved Answer
Step: 1 Unlock

Question Has Been Solved by an Expert!
Get step-by-step solutions from verified subject matter experts
Step: 2 Unlock
Step: 3 Unlock