

Question: mathlab Which of the following scripts would plot y vs x with the X axis range set to 1 to 5 and the Yaxis range
mathlab 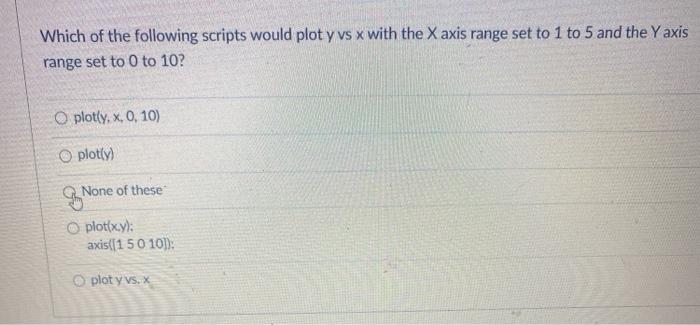
Which of the following scripts would plot y vs x with the X axis range set to 1 to 5 and the Yaxis range set to 0 to 10? O ploty, x, 0, 10) O plotly) BN None of these O plotix.y); axis (1 5 0 10]): ploty vs. x
Step by Step Solution
There are 3 Steps involved in it
1 Expert Approved Answer
Step: 1 Unlock

Question Has Been Solved by an Expert!
Get step-by-step solutions from verified subject matter experts
Step: 2 Unlock
Step: 3 Unlock