

Question: Which of the following scripts would plot y vs x with the X axis range set to 1 to 10 and the Yaxis range set
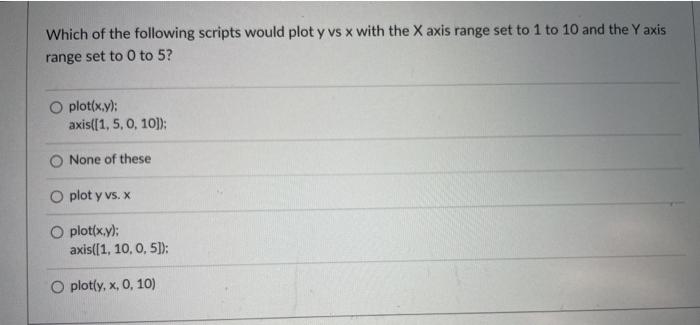
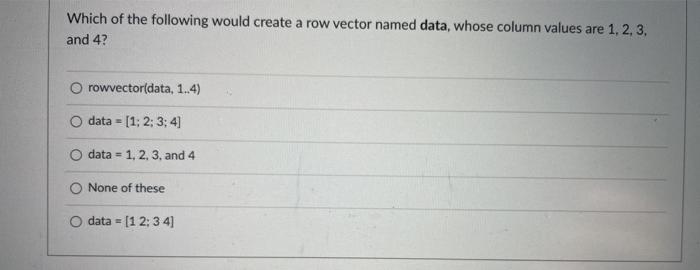
Which of the following scripts would plot y vs x with the X axis range set to 1 to 10 and the Yaxis range set to O to 5? O plot(x,y); axis([1,5, 0, 10]); None of these O plot y vs. O plot(x,y); axis([1, 10, 0.5)); O plot(y, x, 0, 10) Which of the following would create a row vector named data, whose column values are 1, 2, 3, and 4? rowvector(data, 1.4) data = [1: 2: 3:4 data = 1, 2, 3, and 4 None of these data = [1 2:34]
Step by Step Solution
There are 3 Steps involved in it
1 Expert Approved Answer
Step: 1 Unlock

Question Has Been Solved by an Expert!
Get step-by-step solutions from verified subject matter experts
Step: 2 Unlock
Step: 3 Unlock