

Question: Mathnasium and Kumon are both tutoring programs available worldwide which advertise improving math skills for students. How do these two programs compare for grade-school
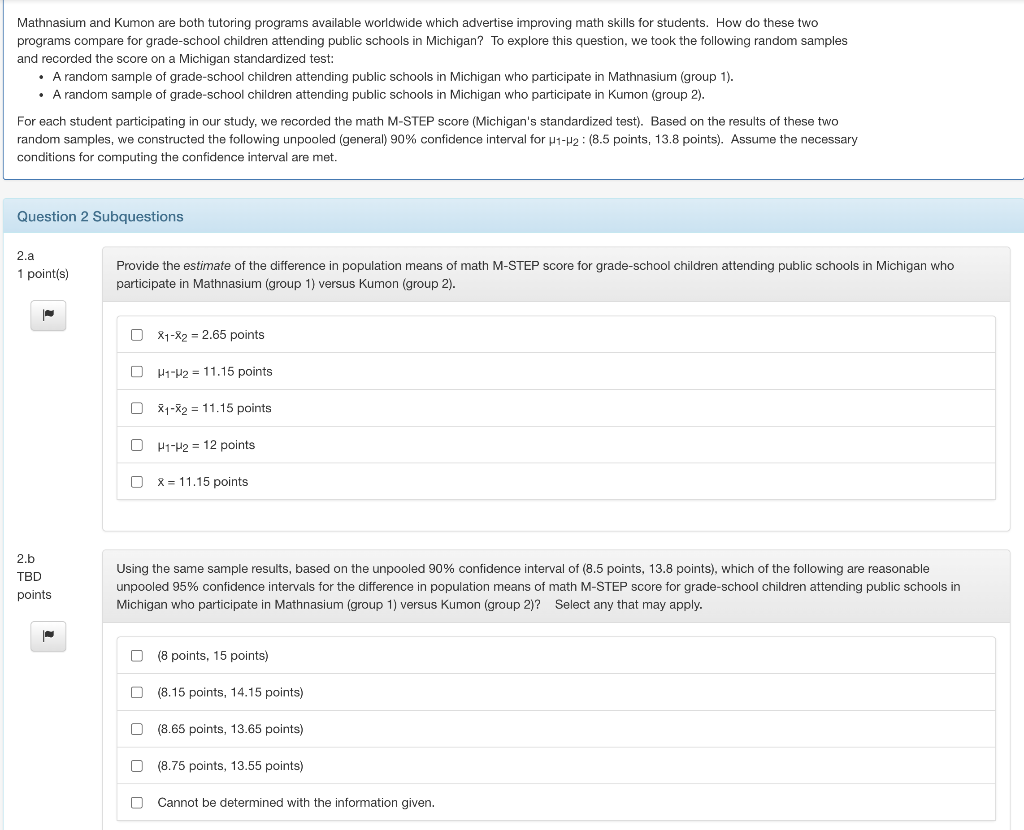
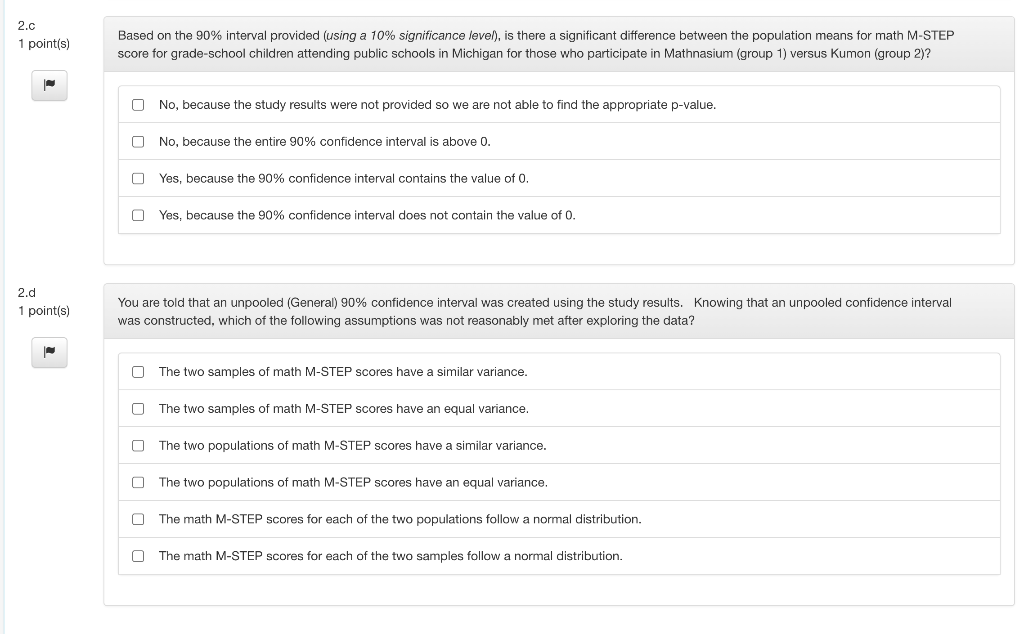
Mathnasium and Kumon are both tutoring programs available worldwide which advertise improving math skills for students. How do these two programs compare for grade-school children attending public schools in Michigan? To explore this question, we took the following random samples and recorded the score on a Michigan standardized test: A random sample of grade-school children attending public schools in Michigan who participate in Mathnasium (group 1). A random sample of grade-school children attending public schools in Michigan who participate in Kumon (group 2). For each student participating in our study, we recorded the math M-STEP score (Michigan's standardized test). Based on the results of these two random samples, we constructed the following unpooled (general) 90% confidence interval for H1-H2: (8.5 points, 13.8 points). Assume the necessary conditions for computing the confidence interval are met. Question 2 Subquestions 2.a 1 point(s) ||~ 2.b TBD points Provide the estimate of the difference in population means of math M-STEP score for grade-school children attending public schools in Michigan who participate in Mathnasium (group 1) versus Kumon (group 2). X1-X2 = 2.65 points H1-H2 11.15 points X1-X2 11.15 points 000 H1-H2= 12 points X = 11.15 points Using the same sample results, based on the unpooled 90% confidence interval of (8.5 points, 13.8 points), which of the following are reasonable unpooled 95% confidence intervals for the difference in population means of math M-STEP score for grade-school children attending public schools in Michigan who participate in Mathnasium (group 1) versus Kumon (group 2)? Select any that may apply. (8 points, 15 points) (8.15 points, 14.15 points) (8.65 points, 13.65 points) (8.75 points, 13.55 points) Cannot be determined with the information given. 2.c 1 point(s) 2.d 1 point(s) Based on the 90% interval provided (using a 10% significance level), is there a significant difference between the population means for math M-STEP score for grade-school children attending public schools in Michigan for those who participate in Mathnasium (group 1) versus Kumon (group 2)? No, because the study results were not provided so we are not able to find the appropriate p-value. U No, because the entire 90% confidence interval is above 0. 0 Yes, because the 90% confidence interval contains the value of 0. Yes, because the 90% confidence interval does not contain the value of 0. You are told that an unpooled (General) 90% confidence interval was created using the study results. Knowing that an unpooled confidence interval was constructed, which of the following assumptions was not reasonably met after exploring the data? O The two samples of math M-STEP scores have a similar variance. 0 The two samples of math M-STEP scores have an equal variance. The two populations of math M-STEP scores have a similar variance. 0 The two populations of math M-STEP scores have an equal variance. The math M-STEP scores for each of the two populations follow a normal distribution. The math M-STEP scores for each of the two samples follow a normal distribution.
Step by Step Solution
3.52 Rating (159 Votes )
There are 3 Steps involved in it
The detailed answer for the above quest... View full answer

Get step-by-step solutions from verified subject matter experts