

Question: mathxl.com Homework Do Homework - Tom Campis Homework Help - Q&A from Online Tutors - Course H Math 150 Statistics Fall 2019 Tom Campis #
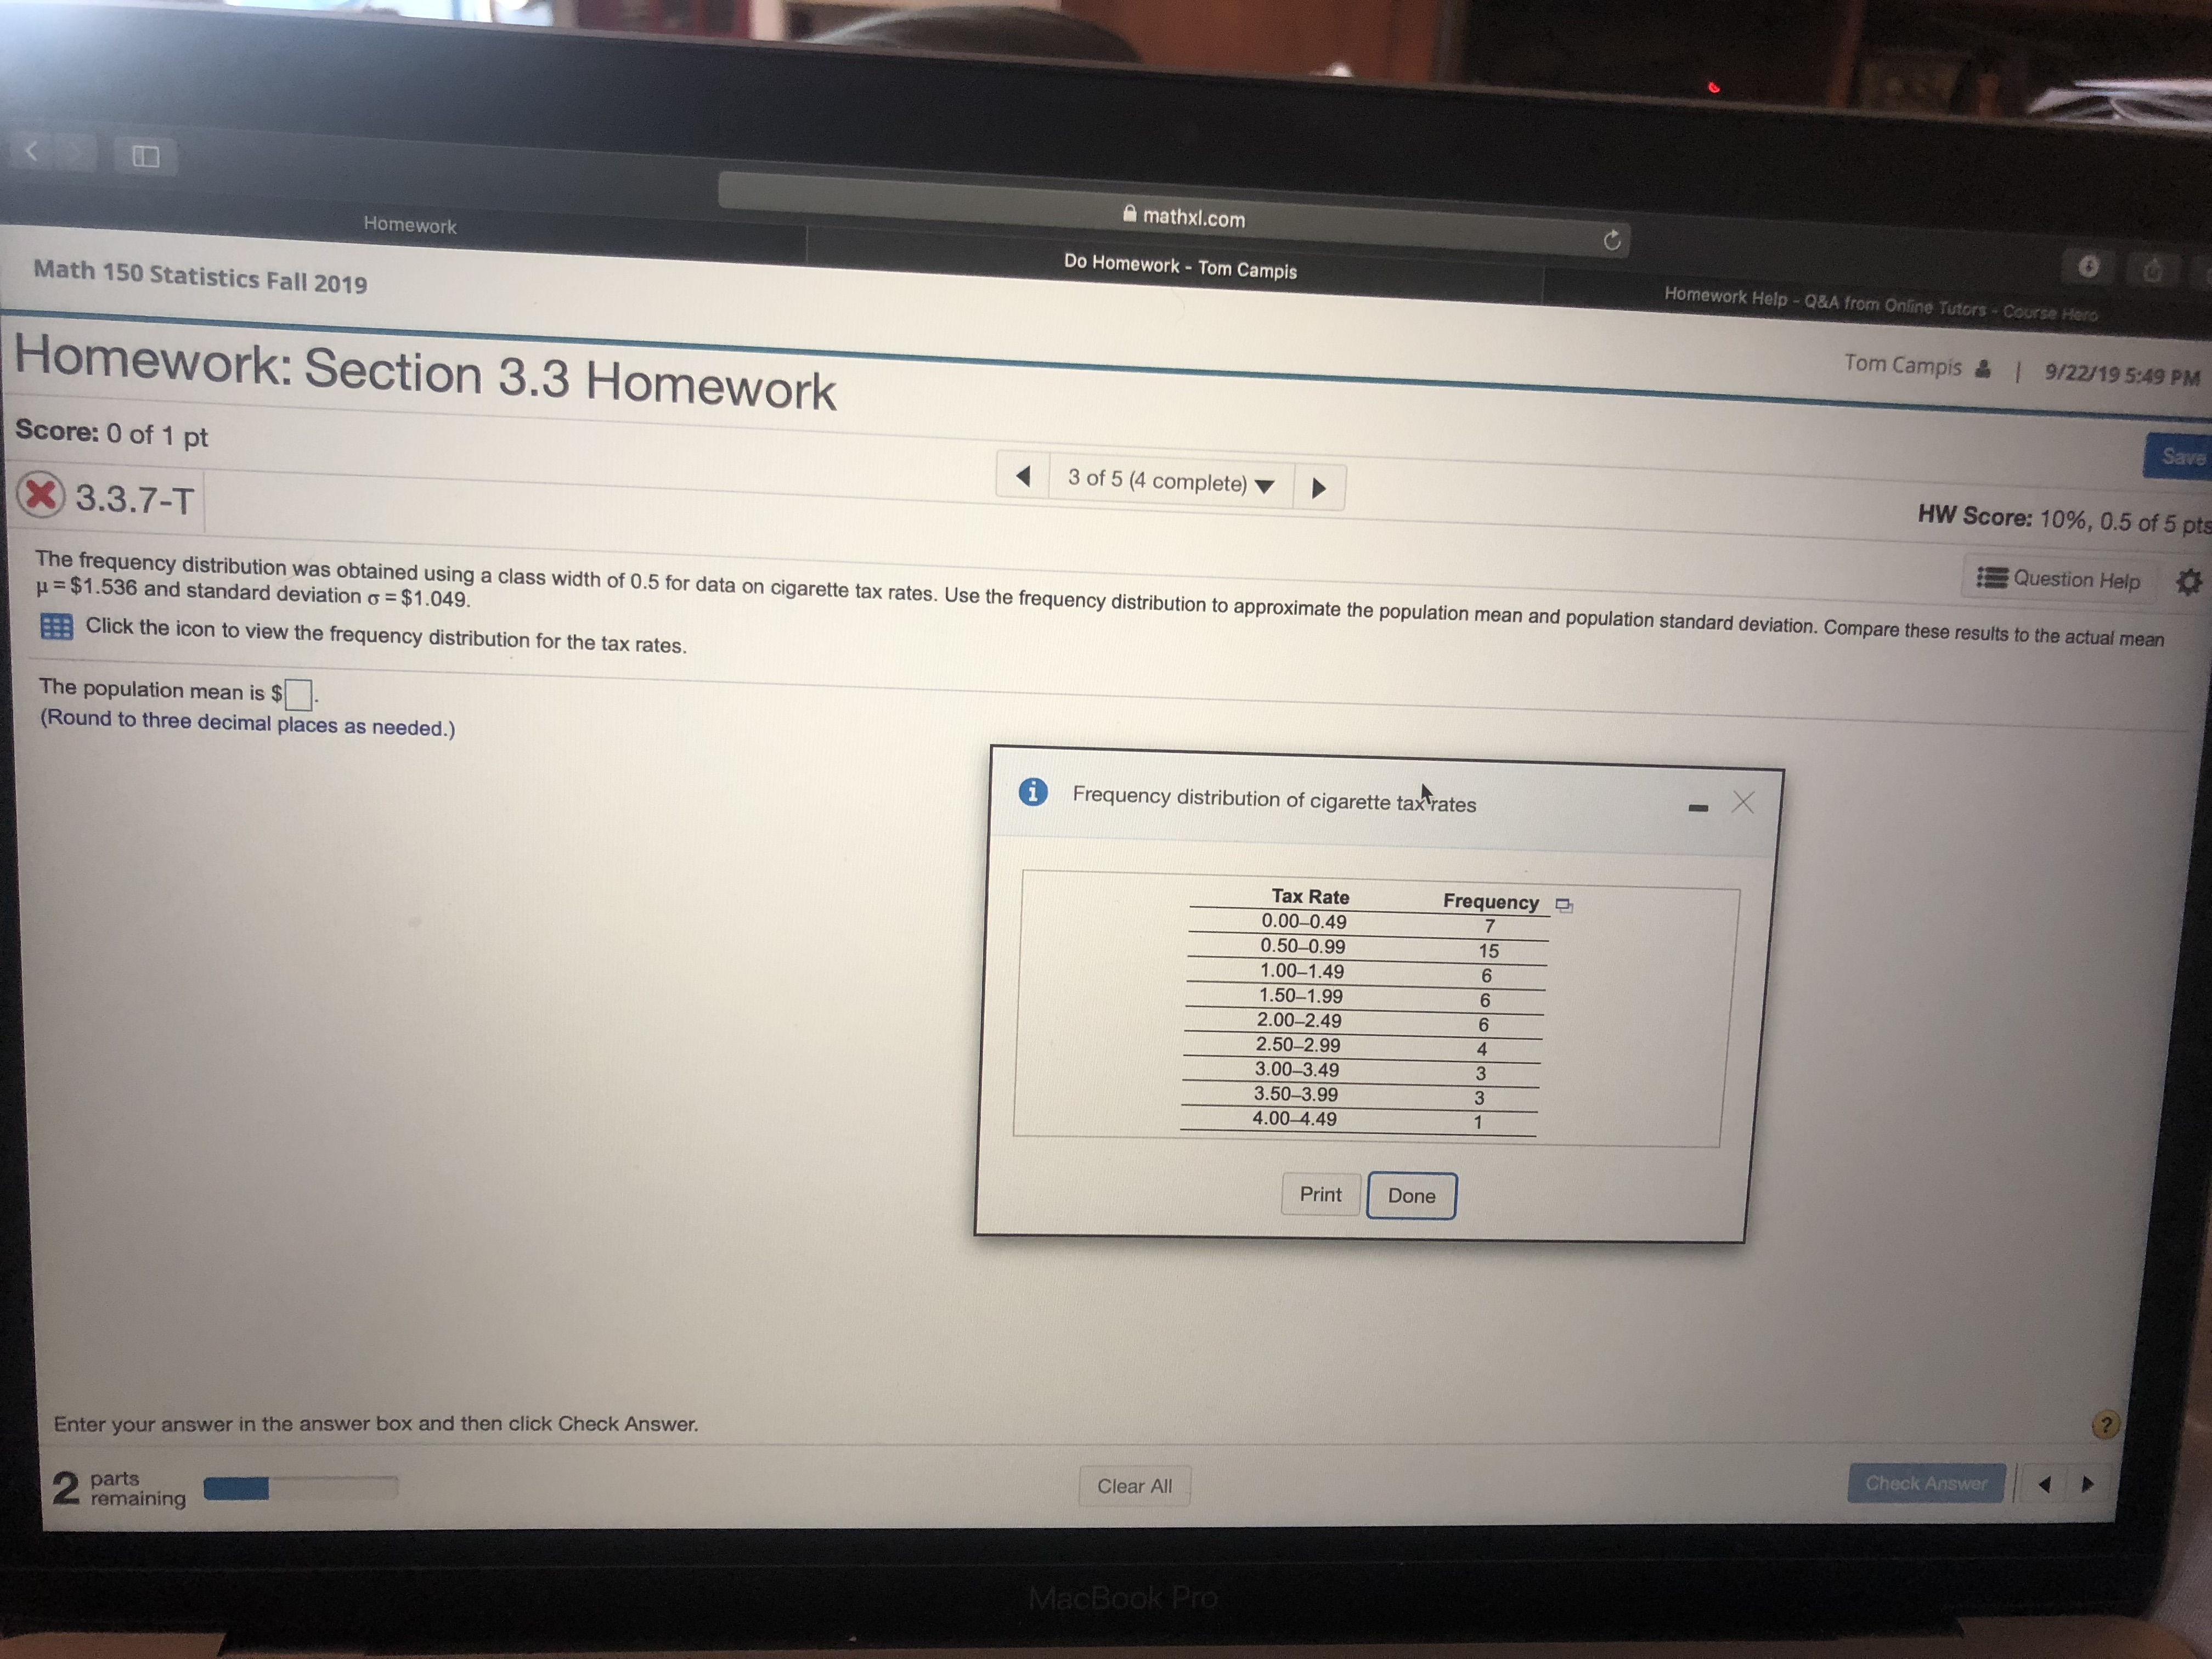
mathxl.com Homework Do Homework - Tom Campis Homework Help - Q&A from Online Tutors - Course H Math 150 Statistics Fall 2019 Tom Campis # | 9/22/19 5:49 PM Homework: Section 3.3 Homework Save Score: 0 of 1 pt 3 of 5 (4 complete) HW Score: 10%, 0.5 of 5 pts X 3.3.7-T Question Help The frequency distribution was obtained using a class width of 0.5 for data on cigarette tax rates. Use the frequency distribution to approximate the population mean and population standard deviation. Compare these results to the actual mean u = $1.536 and standard deviation o = $1.049. Click the icon to view the frequency distribution for the tax rates. The population mean is $. (Round to three decimal places as needed.) 1 Frequency distribution of cigarette tax rates X Tax Rate Frequency 0.00-0.49 0.50-0.99 1.00-1.49 1.50-1.99 2.00-2.49 2.50-2.99 3.00-3.49 3.50-3.99 4.00 4.49 Print Done Enter your answer in the answer box and then click Check Answer. Check Answer Clear All parts remaining MacBook Pro
Step by Step Solution
There are 3 Steps involved in it

Get step-by-step solutions from verified subject matter experts