

Question: mathxl.com Homework Do Homework- Tom Campis Tom Campis & { tomycampisi's Profile - Course Hero Math 150 Statistics Fall 2019 Homework: Section 3.4 Homework
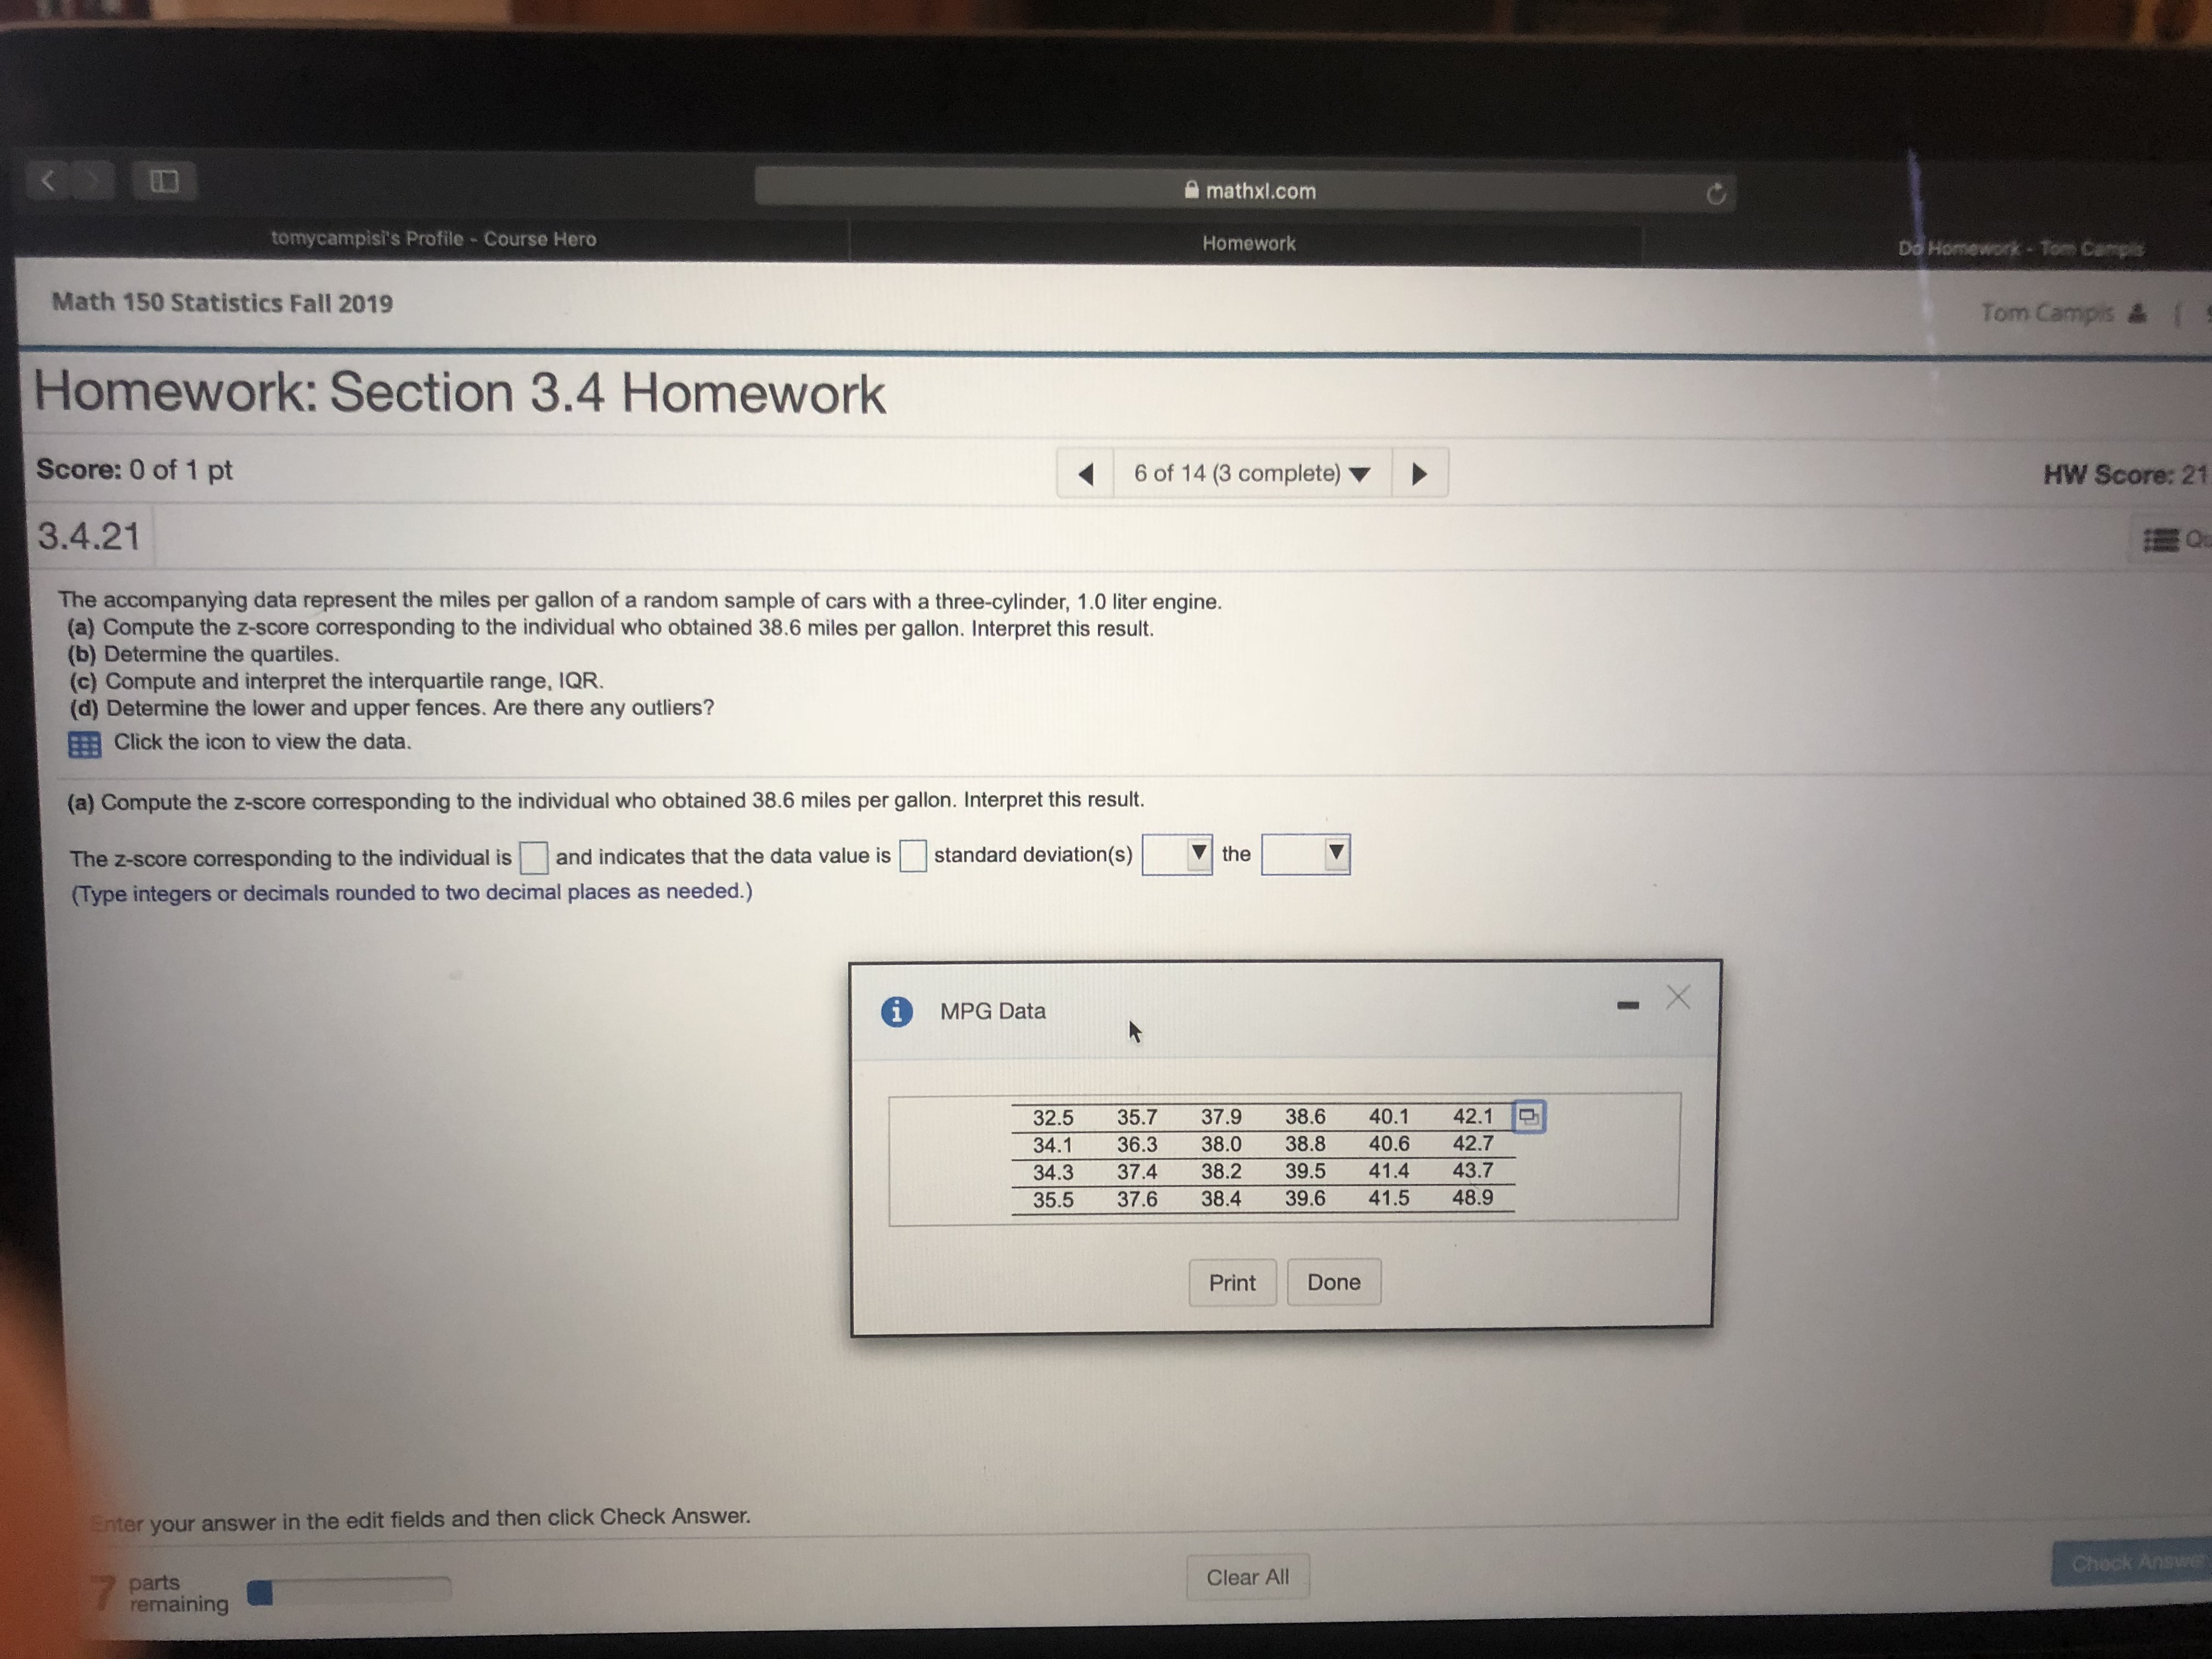
mathxl.com Homework Do Homework- Tom Campis Tom Campis & { tomycampisi's Profile - Course Hero Math 150 Statistics Fall 2019 Homework: Section 3.4 Homework Score: 0 of 1 pt 3.4.21 6 of 14 (3 complete) The accompanying data represent the miles per gallon of a random sample of cars with a three-cylinder, 1.0 liter engine. (a) Compute the z-score corresponding to the individual who obtained 38.6 miles per gallon. Interpret this result. (b) Determine the quartiles. (c) Compute and interpret the interquartile range, IQR. (d) Determine the lower and upper fences. Are there any outliers? Click the icon to view the data. (a) Compute the z-score corresponding to the individual who obtained 38.6 miles per gallon. Interpret this result. The z-score corresponding to the individual is and indicates that the data value is standard deviation(s) (Type integers or decimals rounded to two decimal places as needed.) the Enter your answer in the edit fields and then click Check Answer. 7 parts remaining i MPG Data 32.5 35.7 37.9 38.6 40.1 42.1 34.1 36.3 38.0 38.8 40.6 42.7 34.3 37.4 38.2 39.5 41.4 43.7 35.5 37.6 38.4 39.6 41.5 48.9 Print Done HW Score: 21 Qu Clear All Check Answe
Step by Step Solution
There are 3 Steps involved in it

Get step-by-step solutions from verified subject matter experts