

Question: MATLAB 1. Create a figure that has two curves. Both curves will be on a common set of axes. The two curves are: y =
MATLAB
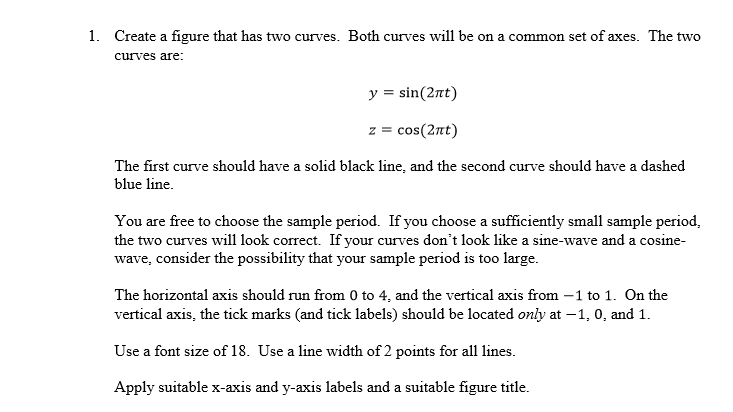
1. Create a figure that has two curves. Both curves will be on a common set of axes. The two curves are: y = sin(2t z = cos(2nt) The first curve should have a solid black line, and the second curve should have a dashed blue line. You are free to choose the sample period. If you choose a sufficiently small sample period, the two curves wll look correct. If your curves don't look like a sine-wave and a cosine- wave, consider the possibility that your sample period is too large. The horizontal axis should run from 0 to 4, and the vertical axis from -1 to 1. On the vertical axis, the tick marks (and tick labels) should be located only at -1, 0, and 1. Use a font size of 18. Use a line width of 2 points for all lines. Apply suitable x-axis and y-axis labels and a suitable figure title
Step by Step Solution
There are 3 Steps involved in it

Get step-by-step solutions from verified subject matter experts