

Question: MATLAB 1. The function subplot allows you to divide a figure into an array where you can assign axes for plotting. subplot returns a handle
MATLAB
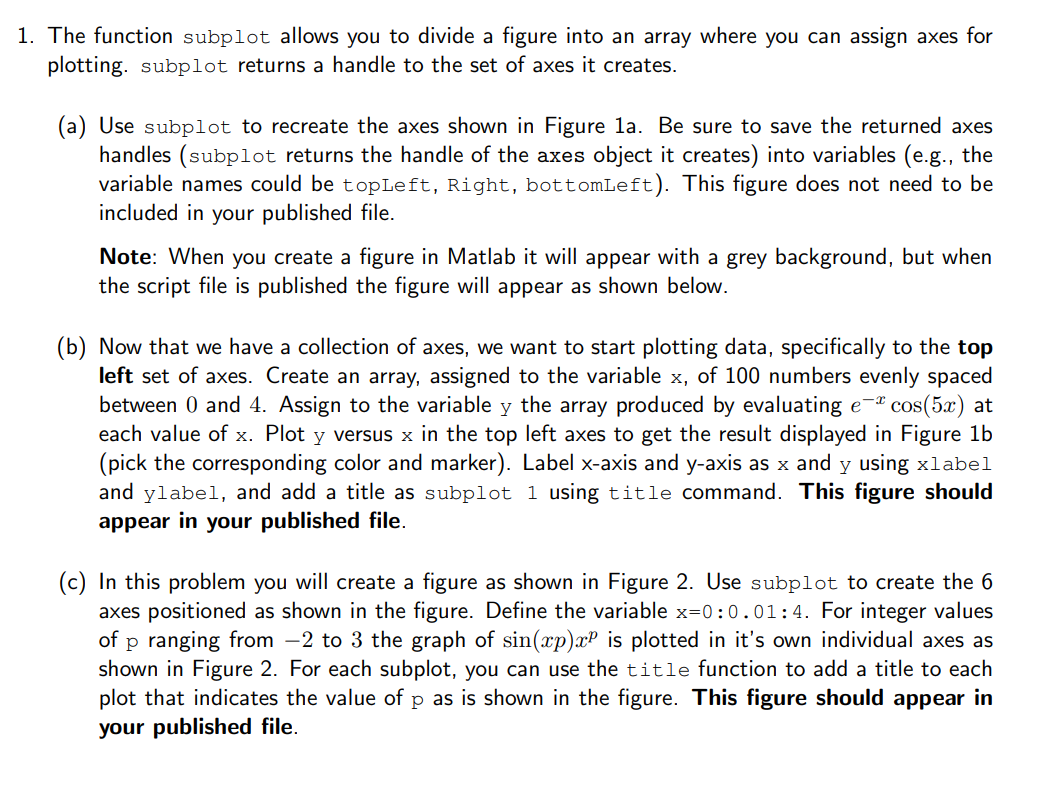
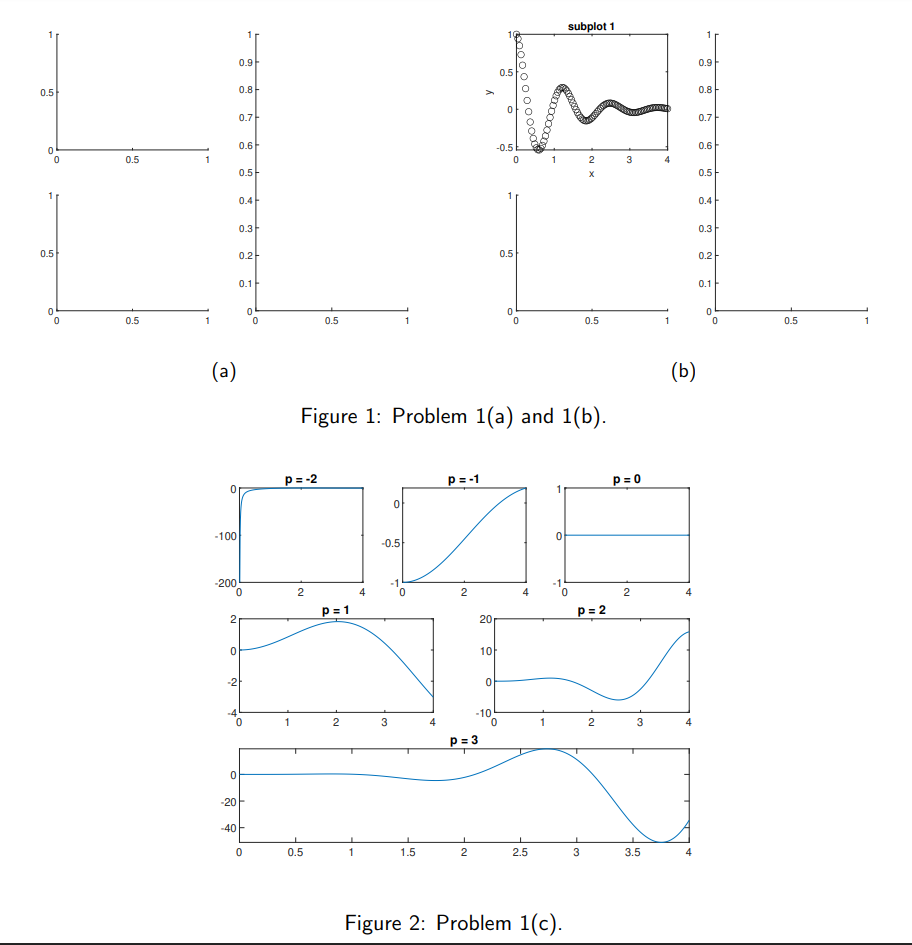
1. The function subplot allows you to divide a figure into an array where you can assign axes for plotting. subplot returns a handle to the set of axes it creates. (a) Use subplot to recreate the axes shown in Figure la. Be sure to save the returned axes handles (subplot returns the handle of the axes object it creates) into variables (e.g., the variable names could be topLeft, Right, bottomLeft). This figure does not need to be included in your published file. Note: When you create a figure in Matlab it will appear with a grey background, but when the script file is published the figure will appear as shown below. (b) Now that we have a collection of axes, we want to start plotting data, specifically to the top left set of axes. Create an array, assigned to the variable x, of 100 numbers evenly spaced between 0 and 4. Assign to the variable y the array produced by evaluating e-* cos(5x) at each value of x. Plot y versus x in the top left axes to get the result displayed in Figure 1b (pick the corresponding color and marker). Label x-axis and y-axis as x and y using xlabel and ylabel, and add a title as subplot 1 using title command. This figure should appear in your published file. (c) In this problem you will create a figure as shown in Figure 2. Use subplot to create the 6 axes positioned as shown in the figure. Define the variable x=0:0.01:4. For integer values of p ranging from 2 to 3 the graph of sin(xp)xP is plotted in it's own individual axes as shown in Figure 2. For each subplot, you can use the title function to add a title to each plot that indicates the value of p as is shown in the figure. This figure should appear in your published file. subplot 1 1 1 0.91 0.9 0.5 0.8 0000 0000 00007 0.8 y 0.7 0.7 0.6 0.6 0 0 -0.5 0 0.5 1 1 2 3 4 0.5 0.5 0.4 0.41 0.31 0.3 0.5 0.2 0.5 0.2 0.1 0.1 0 0 0 0.5 1 0 0.5 0 0 1 0.5 1 0.5 1 (a) (b) Figure 1: Problem 1(a) and 1(b). p= -2 p=-1 P=0 -100 0 -0.5 -1 -1 -200 0 ro 2 2 p=1 p=2 2 20 0 101 - -2) 0 1 2 3 4 1 2 3 -10 0 p=3 0 -20 -40 0 0.5 1 1.5 2 2.5 3 3.5 Figure 2: Problem 1(C)
Step by Step Solution
There are 3 Steps involved in it

Get step-by-step solutions from verified subject matter experts