

Question: MATLAB - Assignment # 2 Problem # 1 Your engineering firm has tasked you with conducting a simple vibration analysis of new shock absorbers that
MATLAB Assignment #
Problem #
Your engineering firm has tasked you with conducting a simple vibration analysis of new shock
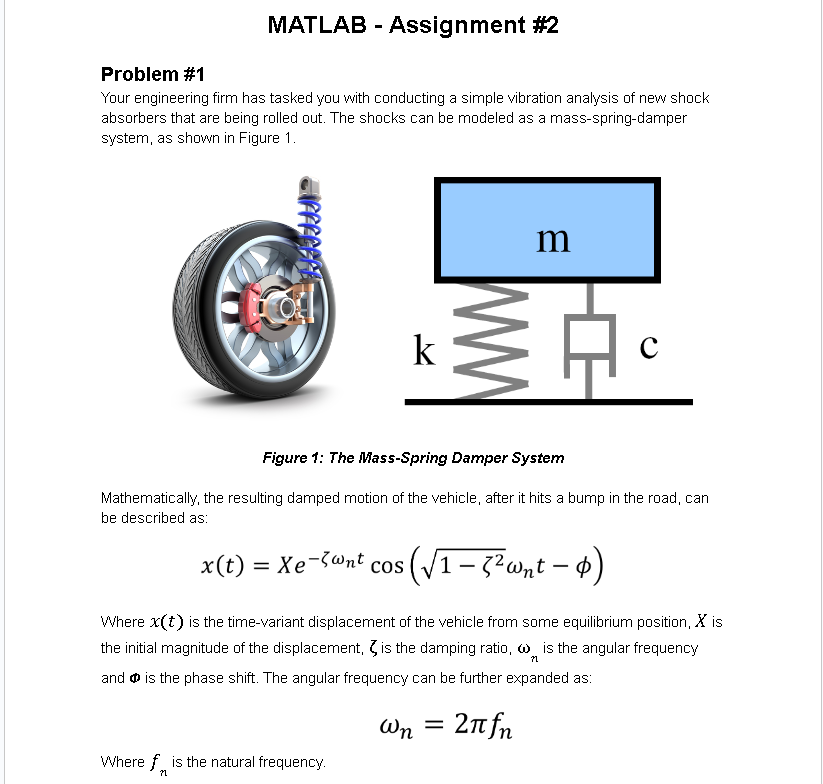
absorbers that are being rolled out. The shocks can be modeled as a massspringdamper
system, as shown in Figure
Figure : The MassSpring Damper System
Mathematically, the resulting damped motion of the vehicle, after it hits a bump in the road, can
be described as:
xtxezeta omega ntcossqrtzeta omega ntphi
Where xt is the timevariant displacement of the vehicle from some equilibrium position, x is
the initial magnitude of the displacement, zeta is the damping ratio, omega n is the angular frequency
and omega is the phase shift. The angular frequency can be further expanded as:
omega npi fn
Where fn is the natural frequency. You have three different shock absorbers to model, which vary only in the magnitude of their damping ratios. Those values are: zeta ; and The remaining parameters are shown in Table
Table : Shock Absorber Parameters
Substituting these values into the displacement equation, we can find Xt for any time, t However, we are not interested in a discrete solution to the problem. To analyze the transient behavior, we will have to obtain the results over a finite period of time ie multiple values of t Determine the variation in displacement of the system over the period leq t leq mathrm~s
Tasks
Using MATLAB, create a vector of time values, where each value will correspond to a solution of the displacement equation. Once you have obtained a vector of solutions numerical displacement values these can be plotted against time, allowing you to analyze the performance of each of the three shock absorbers
Using MATLAB's plot and subplot commands, create separate graphs for the transient response of the three shocks, within the same figure. Create a fourth graph in the same figure that contains all three plots, superimposed on top of one another. All of the plots in the figure should be arranged as a times grid. Also, include: a legend; axis titles and graph titles. Tasks
Using MATLAB, create a vector of time values, where each value will correspond to a solution of the displacement equation. Once you have obtained a vector of solutions numerical displacement values these can be plotted against time, allowing you to analyze the performance of each of the three shock absorbers
Using MATLAB's plot and subplot commands, create separate graphs for the transient response of the three shocks, within the same figure. Create a fourth graph in the same figure that contains all three plots, superimposed on top of one another. All of the plots in the figure should be arranged as a times grid. Also, include: a legend; axis titles and graph titles.
Things to Think About
The time vector should be of the form: boldsymboltmathbft : dt: t boldsymbolf where to represents the initial time tmathrmdt is the timestep and t f is the final time tmathrm~s The size of the timestep can be varied. What size of timestep would you use? What happens to the simulation as you decrease the value of dt
You may encounter an error when inserting the time vector directly into the displacement equation. What does the error message mean? How can you resolve it Hint: Research elementwise multiplication of vectors in MATLAB.
Step by Step Solution
There are 3 Steps involved in it
1 Expert Approved Answer
Step: 1 Unlock

Question Has Been Solved by an Expert!
Get step-by-step solutions from verified subject matter experts
Step: 2 Unlock
Step: 3 Unlock