

Question: MATLAB CODE [ begin{array}{c} dot{x}=V * cos (varphi) dot{y}=V * sin (varphi) dot{z}=- text { descent_rate } dot{varphi}=text { control } end{array}
MATLAB CODE 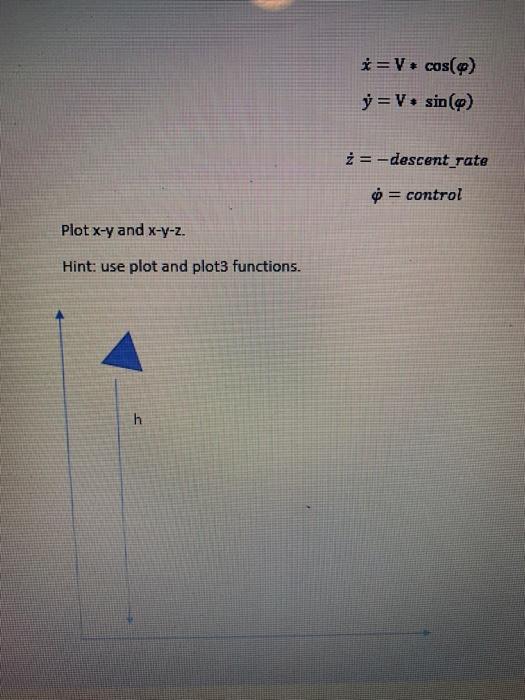
\[ \begin{array}{c} \dot{x}=V * \cos (\varphi) \\ \dot{y}=V * \sin (\varphi) \\ \dot{z}=- \text { descent_rate } \\ \dot{\varphi}=\text { control } \end{array} \] Plot xy and xyz. Hint: use plot and plot3 functions
Step by Step Solution
There are 3 Steps involved in it
1 Expert Approved Answer
Step: 1 Unlock

Question Has Been Solved by an Expert!
Get step-by-step solutions from verified subject matter experts
Step: 2 Unlock
Step: 3 Unlock