

Question: MATLAB CODE ONLY MATLAB CODE ONLY MATLAB CODE ONLY MATLAB CODE ONLY MATLAB CODE ONLY MATLAB CODE ONLY MATLAB CODE ONLY MATLAB CODE ONLY MATLAB
MATLAB CODE ONLY MATLAB CODE ONLY MATLAB CODE ONLY MATLAB CODE ONLY MATLAB CODE ONLY MATLAB CODE ONLY MATLAB CODE ONLY MATLAB CODE ONLY MATLAB CODE ONLY MATLAB CODE ONLY MATLAB CODE ONLY MATLAB CODE ONLY MATLAB CODE ONLY MATLAB CODE ONLY MATLAB CODE ONLY MATLAB CODE ONLY MATLAB CODE ONLY MATLAB CODE ONLY MATLAB CODE ONLY MATLAB CODE ONLY MATLAB CODE ONLY
(requires file data_p2824.csv): Use the RK4 method with a step size = 0.1 years. In Part (a), estimate parameters , , , using trial and error, as in the previous problem. (They may not be optimal, but should give a decent fit). Choices will vary. Note the default parameter values given in the book for Part (c) are not very gooduse your own values instead.
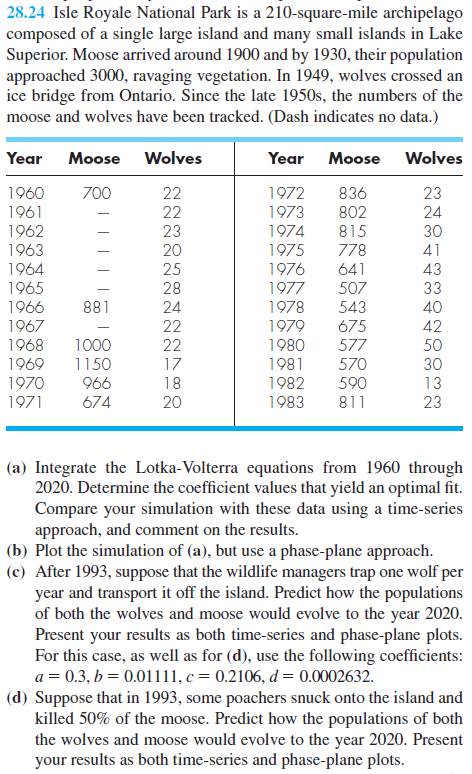
28.24 Isle Royale National Park is a 210-square-mile archipelago composed of a single large island and many small islands in Lake Superior. Moose arrived around 1900 and by 1930, their population approached 3000, ravaging vegetation. In 1949, wolves crossed an ice bridge from Ontario. Since the late 1950s, the numbers of the moose and wolves have been tracked. (Dash indicates no data.) Year Moose Wolves Year Moose Wolves 700 836 23 24 1960 1961 1962 1963 1964 1965 1966 1967 1968 1969 1970 1971 22 22 23 20 25 28 24 22 22 17 18 20 1972 1973 1974 1975 1976 1977 1978 1979 1980 1981 1982 1983 881 802 815 778 641 507 543 675 577 570 590 811 30 41 43 33 40 42 50 30 13 23 1000 1150 966 674 (a) Integrate the Lotka-Volterra equations from 1960 through 2020. Determine the coefficient values that yield an optimal fit. Compare your simulation with these data using a time-series approach, and comment on the results. (b) Plot the simulation of (a), but use a phase-plane approach. (c) After 1993, suppose that the wildlife managers trap one wolf per year and transport it off the island. Predict how the populations of both the wolves and moose would evolve to the year 2020. Present your results as both time-series and phase-plane plots. For this case, as well as for (d), use the following coefficients: a=0.3, b = 0.01111, c = 0.2106, d= 0.0002632. (d) Suppose that in 1993, some poachers snuck onto the island and killed 50% of the moose. Predict how the populations of both the wolves and moose would evolve to the year 2020. Present your results as both time-series and phase-plane plots. 28.24 Isle Royale National Park is a 210-square-mile archipelago composed of a single large island and many small islands in Lake Superior. Moose arrived around 1900 and by 1930, their population approached 3000, ravaging vegetation. In 1949, wolves crossed an ice bridge from Ontario. Since the late 1950s, the numbers of the moose and wolves have been tracked. (Dash indicates no data.) Year Moose Wolves Year Moose Wolves 700 836 23 24 1960 1961 1962 1963 1964 1965 1966 1967 1968 1969 1970 1971 22 22 23 20 25 28 24 22 22 17 18 20 1972 1973 1974 1975 1976 1977 1978 1979 1980 1981 1982 1983 881 802 815 778 641 507 543 675 577 570 590 811 30 41 43 33 40 42 50 30 13 23 1000 1150 966 674 (a) Integrate the Lotka-Volterra equations from 1960 through 2020. Determine the coefficient values that yield an optimal fit. Compare your simulation with these data using a time-series approach, and comment on the results. (b) Plot the simulation of (a), but use a phase-plane approach. (c) After 1993, suppose that the wildlife managers trap one wolf per year and transport it off the island. Predict how the populations of both the wolves and moose would evolve to the year 2020. Present your results as both time-series and phase-plane plots. For this case, as well as for (d), use the following coefficients: a=0.3, b = 0.01111, c = 0.2106, d= 0.0002632. (d) Suppose that in 1993, some poachers snuck onto the island and killed 50% of the moose. Predict how the populations of both the wolves and moose would evolve to the year 2020. Present your results as both time-series and phase-plane plots
Step by Step Solution
There are 3 Steps involved in it

Get step-by-step solutions from verified subject matter experts