

Question: Matlab Code below: % script to compute and plot the frequency spectrum for % the Fourier series coefficients for f(t) % Reference: Advanced Engineering Mathematics
Matlab Code below:
% script to compute and plot the frequency spectrum for
% the Fourier series coefficients for f(t)
% Reference: Advanced Engineering Mathematics with MATLAB
% by Dean Duffy
n = 20; % number of harmonics
an = zeros(n,1);
bn = zeros(n,1);
% compute the Fourier coefficients an and bn
% the coefficients in this example are obtained from the
% Fourier series expansion for
% f(t) = 0, -pi
% t, 0
for i = 1:n
% an(i) = 1/i^2/pi*((-1)^i - 1);
% bn(i) = (-1)^(i+1)/i;
an(i) = 2*(-1)^i/i^2;
bn(i) = (-1)^(i+1)*pi/i + 2/pi/i^3*(-1)^i - 2/pi/i^3;
end
% compute the magnitude
cn = 0.5*sqrt(an.*an + bn.*bn);
% incorporate a0
cn = [pi*pi/3; cn];
harmonics = [0; (1:1:20)'];
% plot the spectrum
axes('FontSize',20) % set the font size
stem(harmonics, cn, 'filled') % plot spectrum as a stem plot
set (gca, 'PlotBoxAspectRatio', [8 4 1]) % set aspect ratio
xlabel('harmonics') % label x axis
ylabel('(a_n^2 + b_n^2)^{1/2}/2') % label y axis
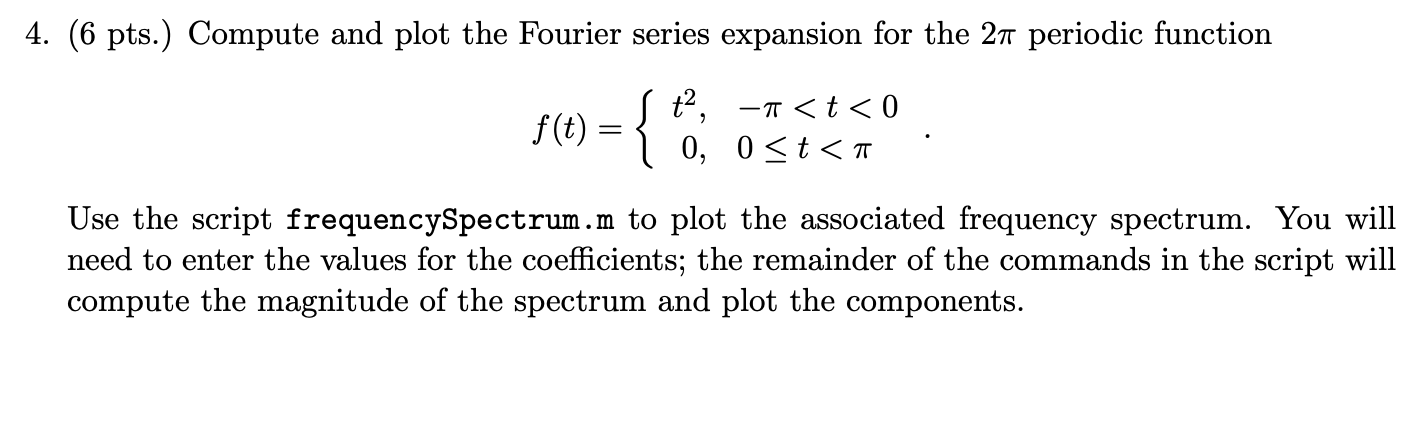
title('Plot of Frequency Spectrum for f(t) = 0, -\pi 4. (6 pts.) Compute and plot the Fourier series expansion for the 27 periodic function I t?, T 0, -a
Step by Step Solution
There are 3 Steps involved in it

Get step-by-step solutions from verified subject matter experts