

Question: MATLAB CODE interest rates Create a plot of y = sin(). Choose an initial interval of x from 0 to 2m in increments of f/100.
MATLAB CODE


interest rates
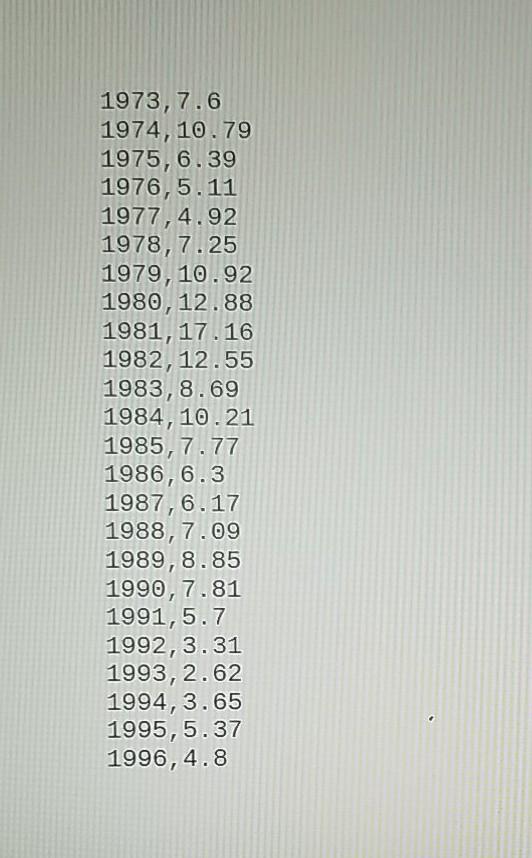
Create a plot of y = sin(). Choose an initial interval of x from 0 to 2m in increments of f/100. Create another plot of y = sin ). This time smooth out your graph choosing an interval of x from 0 to 1/2 in increments of 7/10,000. How does it look? Label the x and y axes using the commands below and add a grid and title to the graph. Load the interest rates.dat file from Canvas. Make a plot using red asterisks to indicate individual points. Label your x and y axes, add a tile, a textbox to the highest interest rate value, and a legend. Plot 2 different graphs on the same axis. Type the command "hold on to do this in between plot commands. Use plot(x, yl, x, y2) where yl = cos(4x) and y2 = sin(x). Change the color and line style to something of your choosing to make the graph look nice. Add a title and lengend. Practice Exercise 5.2 pg. 164-165 PRACTICE EXERCISE 5.2 The correct answers can be found on the Pearson website. 1. Subdivide a figure window into two rows and one column. 2. In the top window, plot y =tan(x) for -1.5
Step by Step Solution
There are 3 Steps involved in it

Get step-by-step solutions from verified subject matter experts