

Question: Matlab code needed to produce the following plot shown below. Sketch to scale the isodops for a radar traveling horizontally at 300 ms-1 at a
Matlab code needed to produce the following plot shown below. Sketch to scale the isodops for a radar traveling horizontally at 300 ms-1 at a height of 10 km and a wavelength of 10 cm.
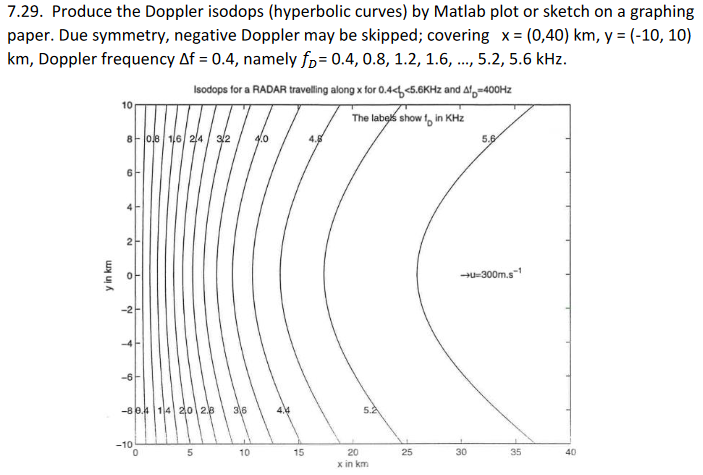
7.29. Produce the Doppler isodops (hyperbolic curves) by Matlab plot or sketch on a graphing paper. Due symmetry, negative Doppler may be skipped; covering x = (0,40) km, y = (-10, 10) km, Doppler frequency Af = 0.4, namely fo= 0.4, 0.8, 1.2, 1.6, ..., 5.2, 5.6 kHz. Isodops for a RADAR travelling along x for 0.4
Step by Step Solution
There are 3 Steps involved in it
1 Expert Approved Answer
Step: 1 Unlock

Question Has Been Solved by an Expert!
Get step-by-step solutions from verified subject matter experts
Step: 2 Unlock
Step: 3 Unlock