

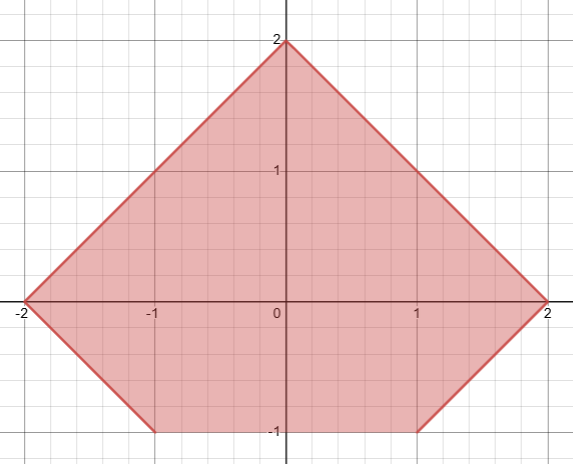
Question: MATLAB code to plot S = { ( x , y ) : | x | + | y | = 2 and y >
MATLAB code to plot S x y : xy and y
Picture from desmos to show what it looks like.
Step by Step Solution
There are 3 Steps involved in it
1 Expert Approved Answer
Step: 1 Unlock

To plot the region described by x y 2 with y 1 in MATLAB you can use the following code matlab Defin... View full answer
Question Has Been Solved by an Expert!
Get step-by-step solutions from verified subject matter experts
Step: 2 Unlock
Step: 3 Unlock